By Alain Savoie, Creative and Technical Director, Bannister Lake Software
The 2018 US Open celebrated its 50th year this season at the USTA Billie Jean National Tennis Center in Flushing Meadows, NY. Approximately 870 players took part in the two-week tournament which included 899 games played with over 700,000 spectators in attendance. Fans got a glimpse of their favorite tennis stars making history, including Naomi Osaka, the first Japanese player ever to win a Grand Slam singles championship and Novak Djokovic tying Pete Sampras’ record to become third among all-time Grand Slam champions.
While ESPN held the exclusive broadcast rights to the tournament, this was Van Wagner Sports and Entertainment’s (VWSE) sixth year of producing the video board and LED production for the main show courts & around the grounds. Marquee matches took place at the Arthur Ashe Stadium, alongside a full slate of daytime and evening matches inside the newly re-constructed Louis Armstrong Stadium and the intimate Grandstand Stadium. Van Wagner’s responsibilities included both in-stadium screen production for the 3 show courts, as well as the numerous grounds displays showcasing the matches on 16 televised courts throughout the facility.
On July 10th, approximately 5 weeks before the start of the tournament, Alain Savoie from Bannister Lake and J. Marty Dormany of The Academy of Lower Thirds were approached by Nate McCoart, Director of Technical Operations at VWSE Productions to produce a Ross Video XPression-based graphics package for the tournament.
VWSE is no stranger to XPression as they have deployed XPression Graphics Engines on numerous events over the past years, but this was their first implementation of XPression at the US Open.
“For a few years now we have been wanting to leverage XPression and the ability to render dynamic graphics in real-time for this particular project. We are thrilled that Alain was able to make that vision a reality with us this year and look forward to continuing our relationship with Bannister Lake and AcademyL3. Without an all-star team from the designers to the operators, we would never be able to make this happen, especially given the timeline and complex nature of the project.” – Nate McCoart, Director of Technical Operations at VWSE Productions.

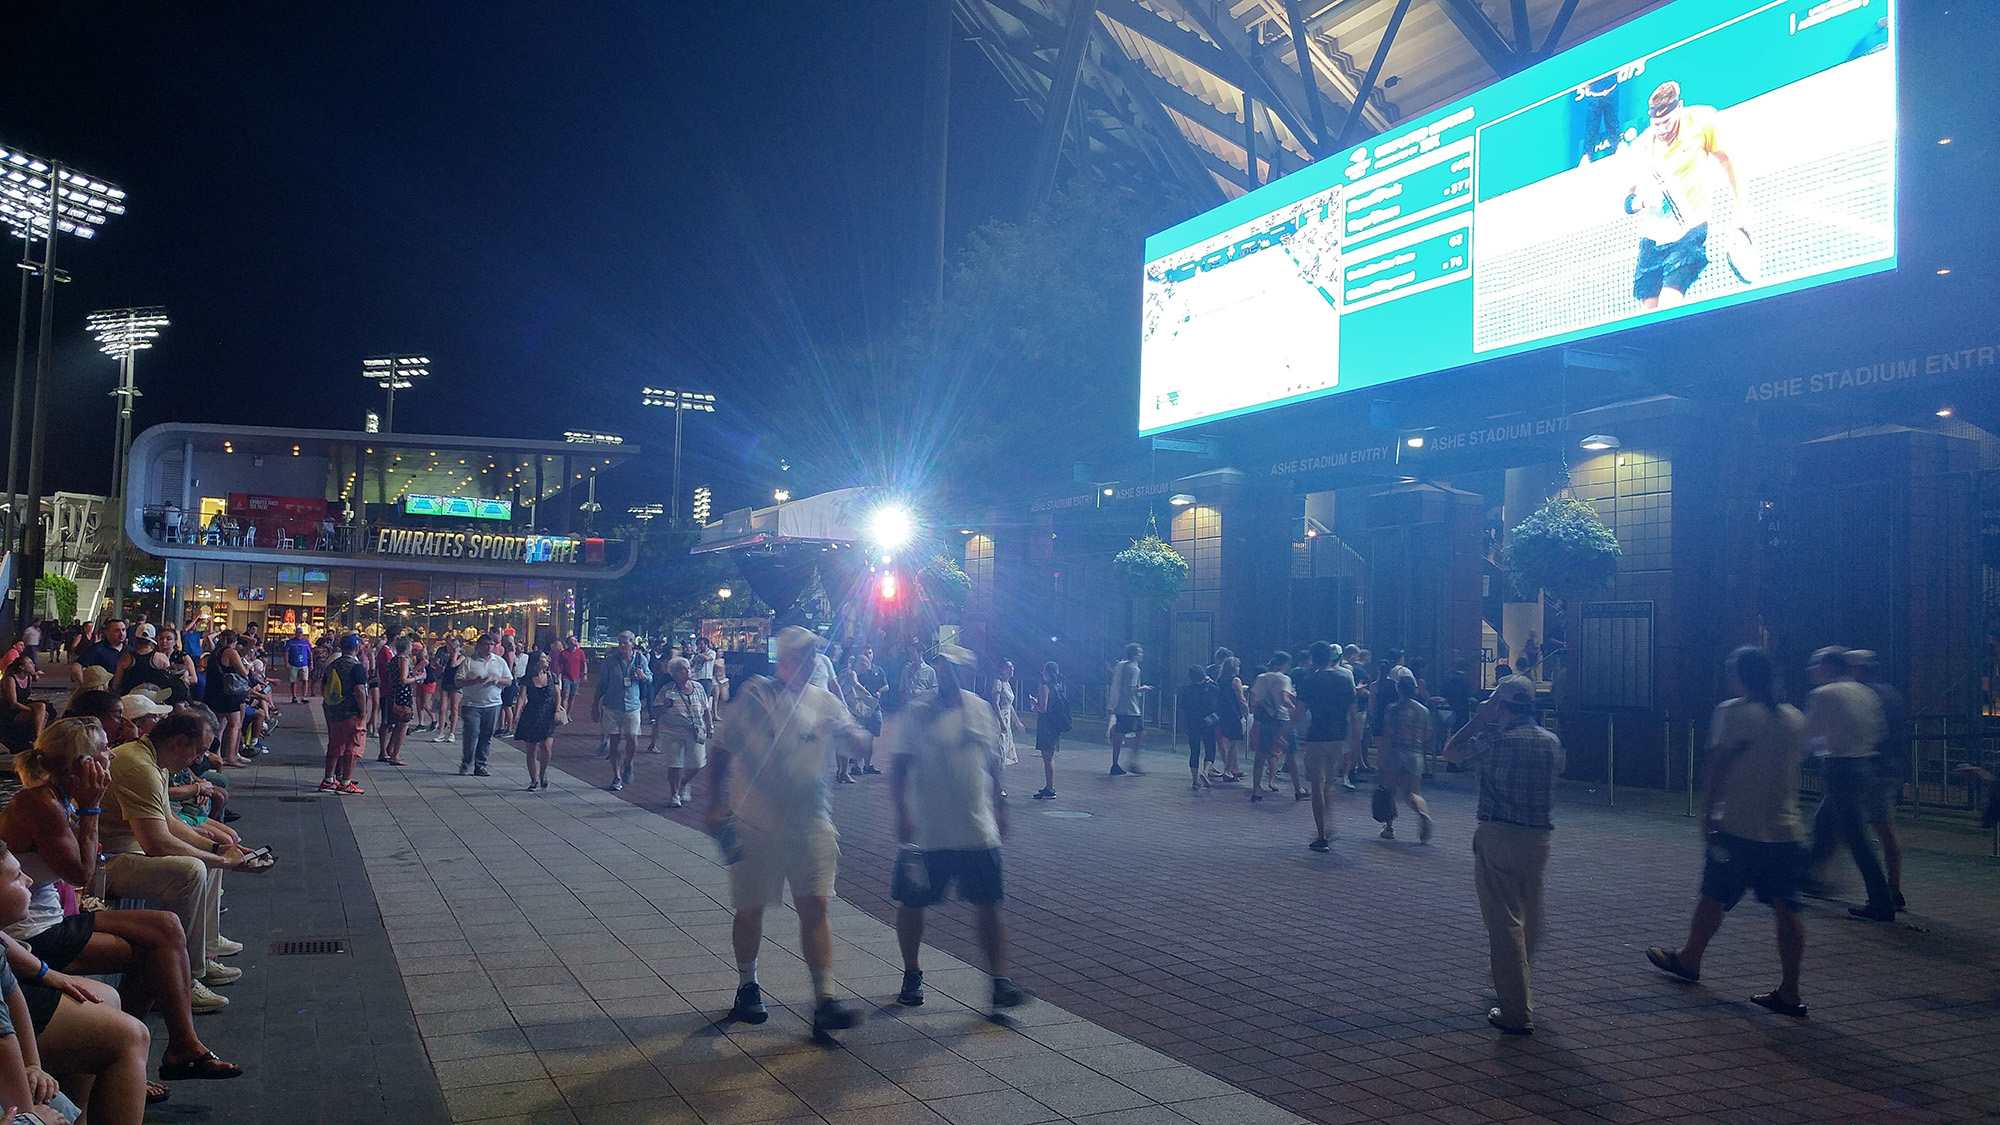
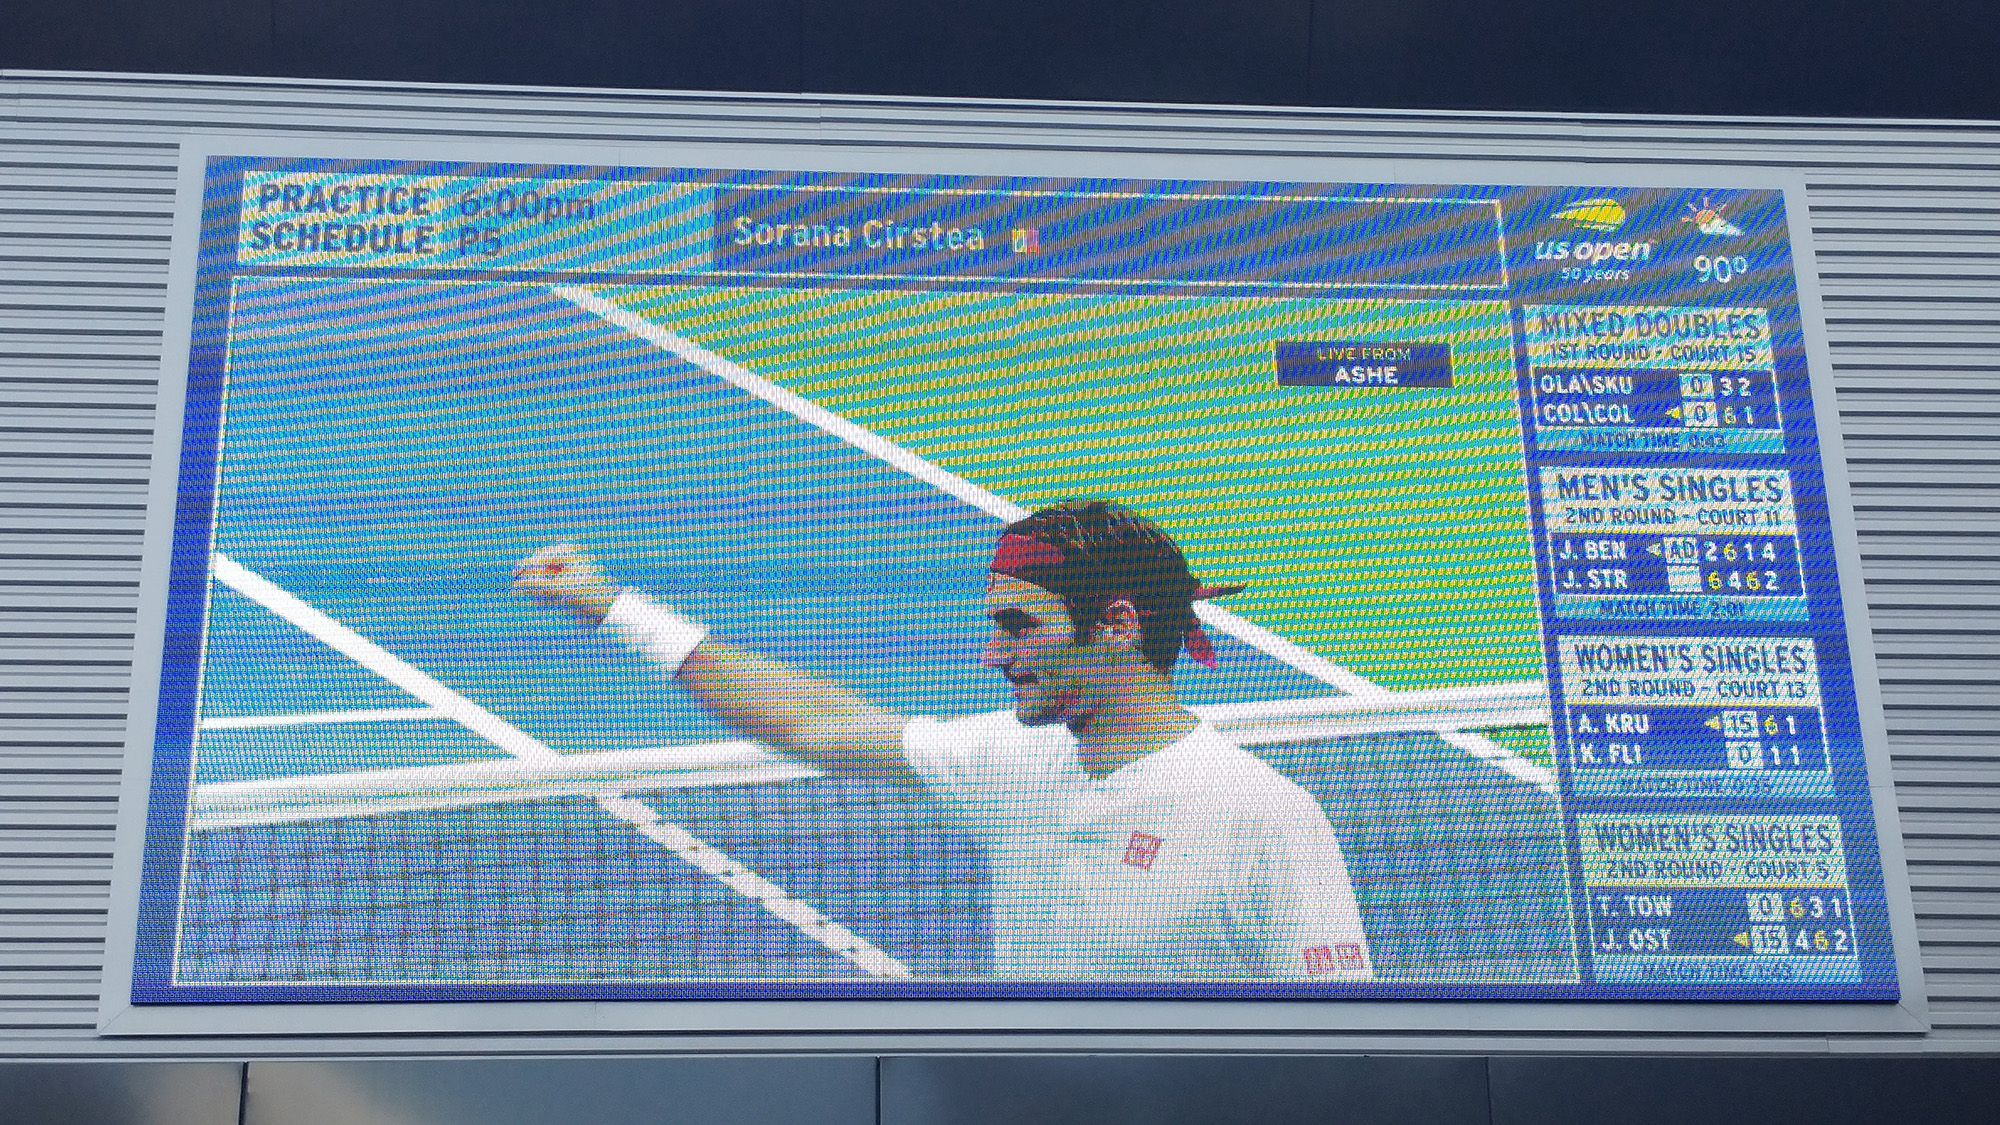
The project also included data integration with SMT, the tournament’s data provider. The signage around the facility included standard 16×9 video displays, ribbon boards, a vertical tower screen and an 80 foot by 12 foot “Superwall” in the South Plaza outside Arthur Ashe Stadium. Having multiple displays with non-standard aspect ratios meant we needed to incorporate Ross’ new multi-display real-time graphics designer and controller, Tessera feature in XPression.
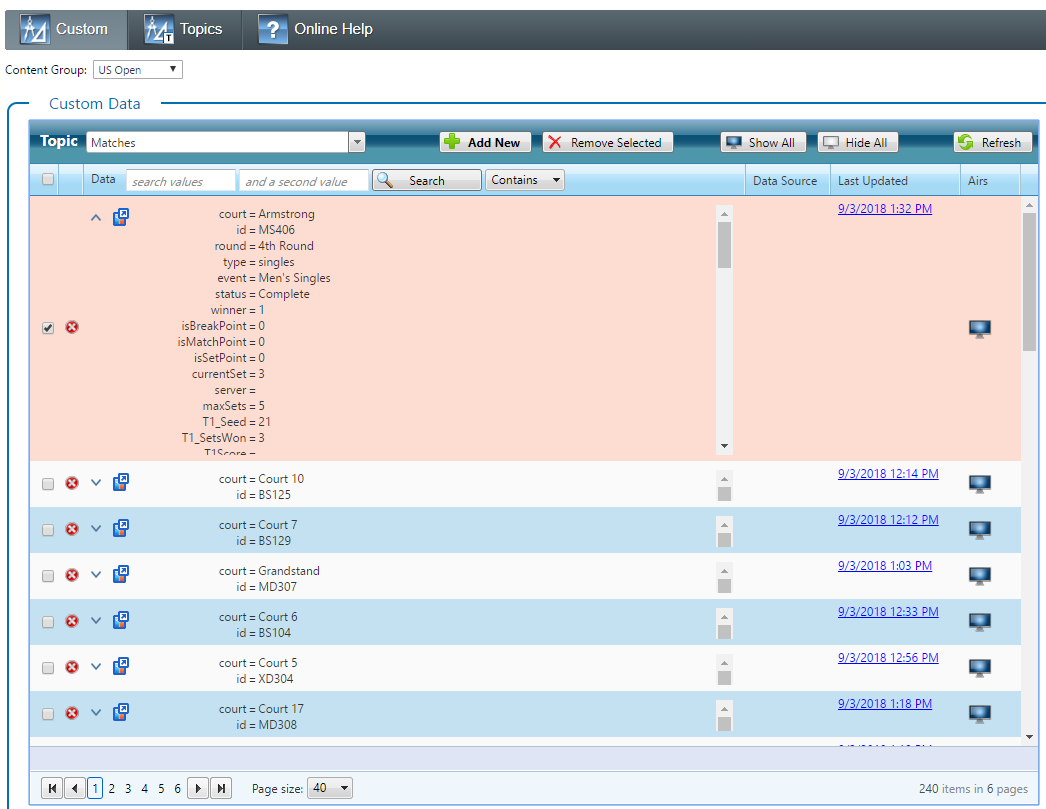
While in principle, creating a graphic package in 5 weeks is relatively do-able, it became far more complicated considering the tight turnaround and the method in which SMT was going to be providing data, which included different xml files sent every second that a matches’ statistical data was being updated (roughly 200,000 xml files), we needed a solution that could handle and filter the vast amounts of data, and in turn generate a simple API that multiple XPression systems could handle.
With production taking place in 3 separate stadiums as well as on the grounds, this data feed needed to incorporate a simple call up method for any possible matches. In addition, the XPression graphic scenes would have to accommodate the variations between Men’s Singles, Women’s Singles and Doubles. These requirements were extremely complex and required a mission-critical solution quickly.
“We knew Bannister Lake’s Chameleon could handle the complexity. It’s the industry’s most powerful engine for aggregating any data type and it’s the only way we could have pulled off the US Open project under the extreme time constrictions; that and all the hard work by Alain and the team.”- Georg Hentsch , President Bannister Lake.
Chameleon software has been used for years to create and automate broadcast tickers, primarily in the Canadian media market. Chameleon’s features include aggregating and moderating feeds such as news, weather, sports, traffic, financial, elections and social media data. Its specialty has always been to generate automated rundowns and output tickers for network television and digital signage. Only recently has Chameleon been utilized for event-based productions; most notably eSports tournaments which typically includes hundreds of matches played over a short amount of time with a large number of players.
Sound familiar?
Some graphic samples were sent to our team on July 26th, and we began receiving data from SMT on Aug 8th for testing, which meant we were able to create and test scenes and scenarios. Chameleon has tight integration with Ross XPression’s API, which meant, dealing with ticker elements such as matches in-progress/scheduled/completed, along with messaging and social media, were treated as broadcast tickers, as oppose to native sequence items. However, the pressing question was: Does Chameleon’s ticker support integration with Ross’s Tessera option? This has never been tested before.

We were thrilled to discover that not only does Chameleon support Tessera, it was relatively easy to create a display solution. With only 30 minutes of playing around with the feature, we were able to quickly build large formatted scenes, populated with Chameleon data, and generate large scaled tickers for venue and in-stadium signage.
“Working with VWSE, Alain Savoie has implemented the first XPression Tessera or Tessera SE project without Ross Video or one of our dealers assisting. Tessera was created to synchronize the outputs of multiple XPression engines together to create one massive display. The first project for XPression Tessera was over 21,000 pixels wide and used up to 12 channels. That can be intimidating, but Alain has done what we hoped others will; tried it and found out it isn’t as scary as it seems. Instead, it can be quite empowering.” – Patrick Twomey, Director of Xpression Product Marketing
The XPression scenes required style layouts that complimented the 5 set matches for men’s singles, the 3 set matches for women’s and other single events, and the double names for doubles matches. This was needed for both the ticker solutions and for the main screen broadcast. Therefore, on the automated ticker side, the layouts needed to change automatically, while on the main screen, the operators needed to guarantee the scenes were going to look correct, regardless of what matches were played. This meant the XPression scenes required a lot of Visual Logic, a feature that made it easy to program the different layouts in XPression.
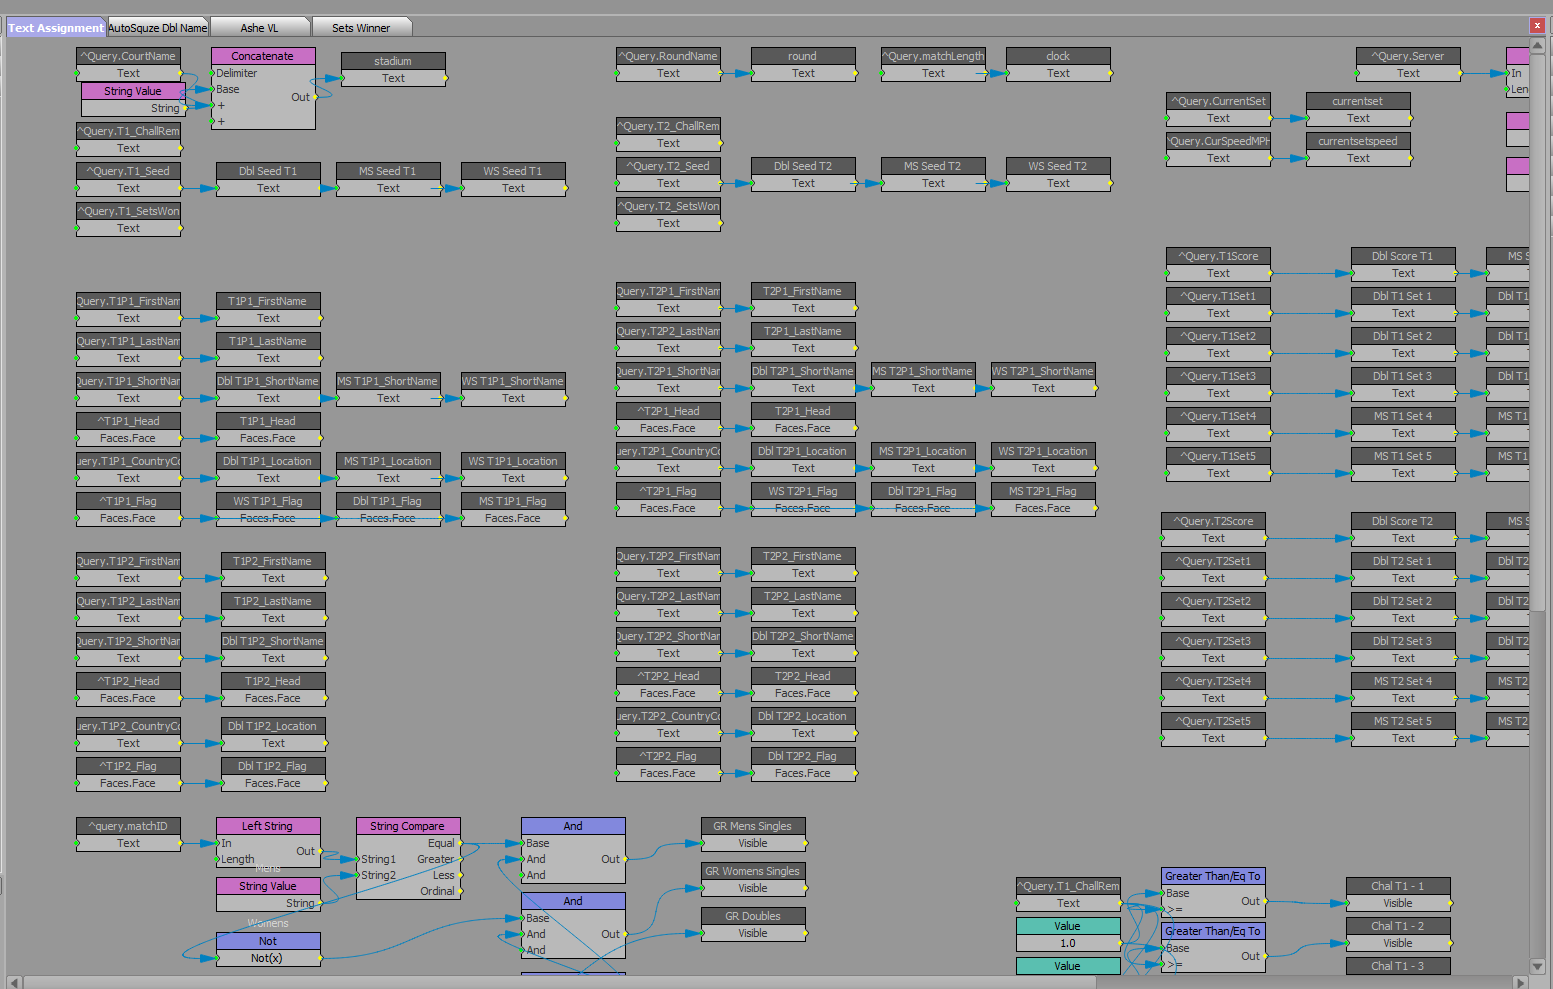
The manual main screens were also automated up to a point. Chameleon generated an XML URL, which included everything that we needed for every match during the tournament. Using some of XPression’s powerful scripting features, the entire graphics package would change based on the single MatchID SMT provided. By entering the match ID number into Ross Video’s Dashboard, it automatically transformed the scene layouts to accommodate the match type and populated the text fields and graphics for every aspect of the match, including player names, flags, headshots, scores, sets winners, challenges remaining and others. In some cases, the PlayerID generated from the MatchID, linked to player profile scenes which included their personal info such as place of birth, height, weight, handed and others.
This workflow was significant for the post production process as well. In the past, editors and graphic designers had to work throughout the night to create the next day’s matchup graphics. Utilizing XPression powered by Chameleon’s data integration, everything was rendered in real-time. As a result, hundreds of graphic design and operator hours were saved during this years’ production.
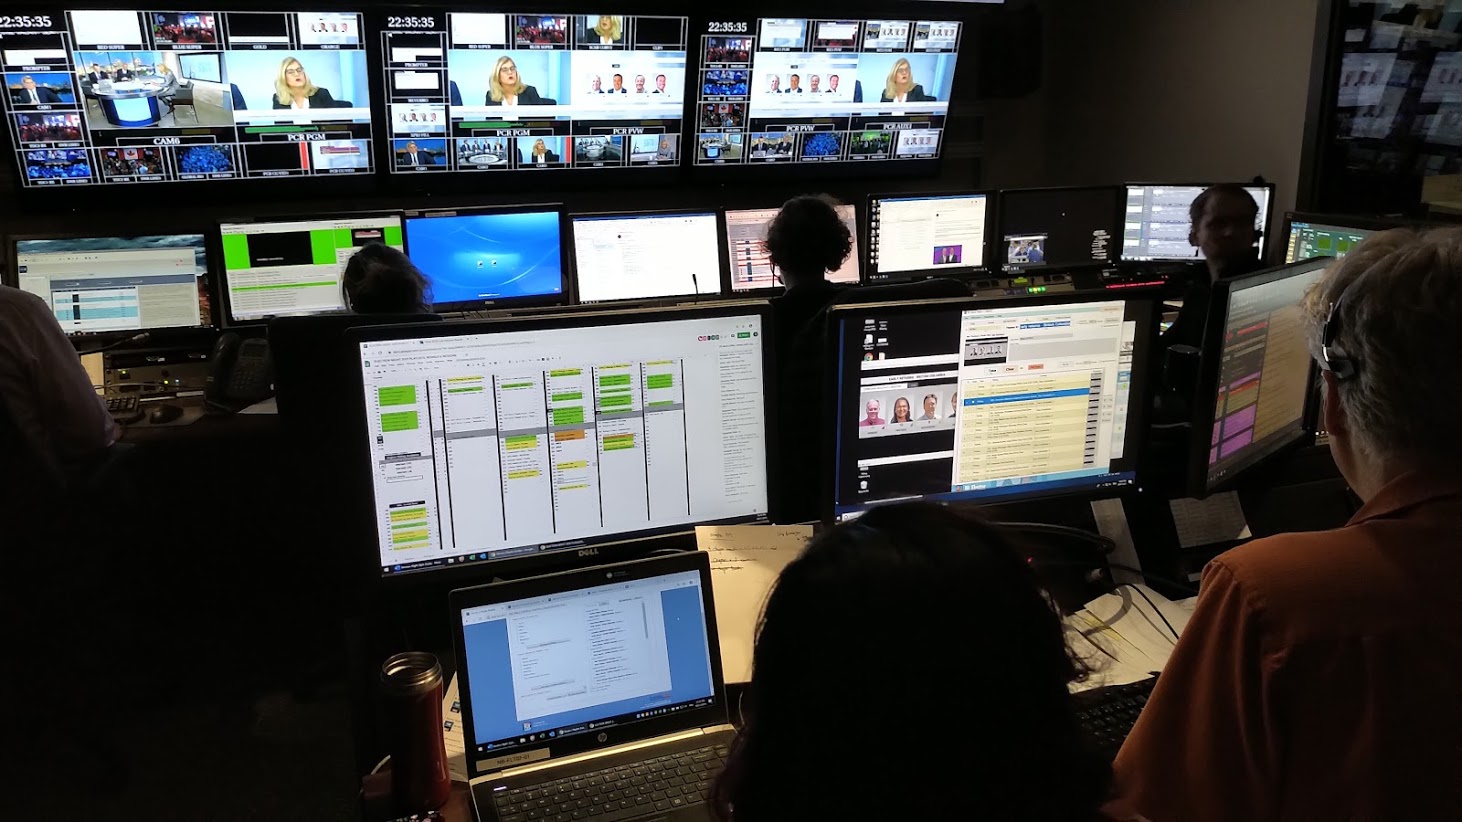
The production was executed flawlessly without any graphic issues. We had a total of 7 XPressions running simultaneously with 15 output channels, displaying 15 different screen layout styles using Tessera. On four of the XPressions, Tessera was running as a single engine in order to call up full frame graphics and stadium fascias at the same time. Plus, we had 11 tickers running different content on different layouts as well.
“Because the Xpression project and the Bannister Lake data software was set up so well, it allowed us the flexibility to handle the workflow changes as they popped up. Because we had to trigger the fullscreen clips and fascia simultaneously, we had hotkeys all over the keyboard! That simple Xpression feature improved our workflow by letting us keep the focus in one place. I think the client was impressed with how smoothly everything went, including some last-minute changes on the fly.“ – Jeannemarie Tracey & Michelle Lippitt, New York based Xpression/Chyron Operators
The XPression templates were created with enough flexibility that CG operators had the choice between using linked data or manual entry or using Sequencer instead of Dashboard. The original concept was for the XPression scenes to be fully operational using Dashboard so that scenes and templates could be called up using a single button. However, the system had the flexibility to allow the 4 operators working on the project to use the operational workflow that worked best for them, all driven by the single MatchID.
Dashboard was used to trigger tickers for the place-based signage around the venues. In some cases, the vision switcher was also able to trigger the different ticker layouts for the South Plaza Superwall at the venue using Dashboard in combination with RossTalk commands.
Throughout the event we were also receiving closed caption data from VITAC, for both the Arthur Ashe and Louis Armstrong stadiums, connected via Datalinq. Our original idea was to have the Datalinq server at one location feed all the systems. Although in principle it was a good idea, it did create concerns if something were to happen to the data server. So instead, we had the Datalinqs spread to multiple locations. Closed captioning had its own Datalinq on a separate system. The Chameleon Datalinq was setup locally on every XPression. Social media and special 50th anniversary player data was on another Datalinq server.
Chameleon however, was installed locally on one of the backup XPressions, serving as the gateway between SMT and output. As backup, our SMT US Open reader was also being used simultaneously on our Bannister Lake Cloud server in case anything were to happen. If the primary server were to go down, it was an easy swap of IP addresses to get our score bugs and data up and running.
Since we were all enclosed on our own network, the production staff was using an open WiFi connection. We needed an easy way for them to enter daily and hourly messages on our venue tickers. Bannister Lake’s Community data service provided the solution. We created an account for the US Open producers and had them enter stories on our cloud instance. Using our Bannister Lake’s Community reader, we pulled those news items every minute and automatically had them appear on the tickers, without any operator intervention.
In addition to news, match stats, games in-progress, schedule, completed and weather info, we also showcased the grounds’ practice schedule, which automatically appears every morning as fans entered the venue. Fans could also interact with social media using Tagboard’s Social Media engine which was powering the moderation of Twitter, Facebook and Instagram photos, all funneled through Chameleon.
The US Open was an absolute beast of a project, and we learned a lot from the experience. We’re extremely confident with the solutions we devised and discovered that we could apply these same techniques on multiple types of high-profile, complex, data-centric events and production scenarios. A big thank you to VWSE Productions for accommodating Bannister Lake during this production as well as to The Academy of Lower Thirds for entrusting us with this assignment.