Bannister Lake Software a Smash at the 2018 US Open

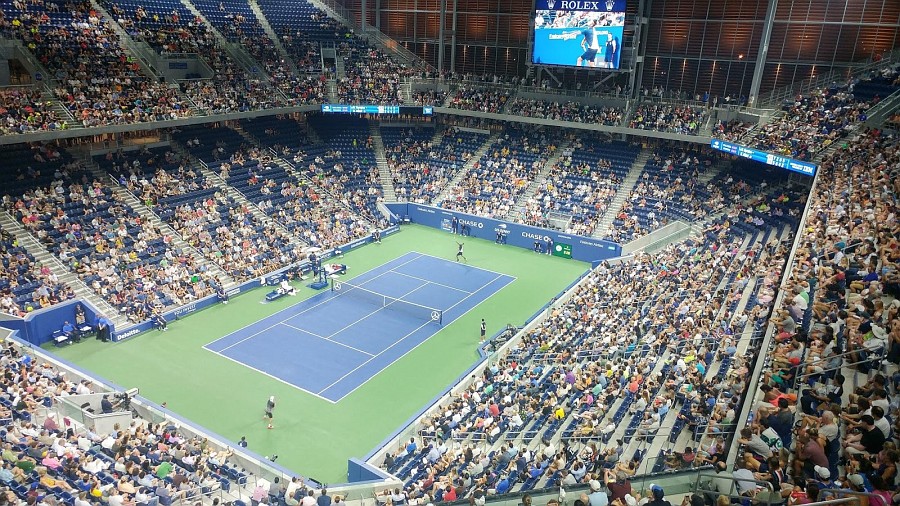
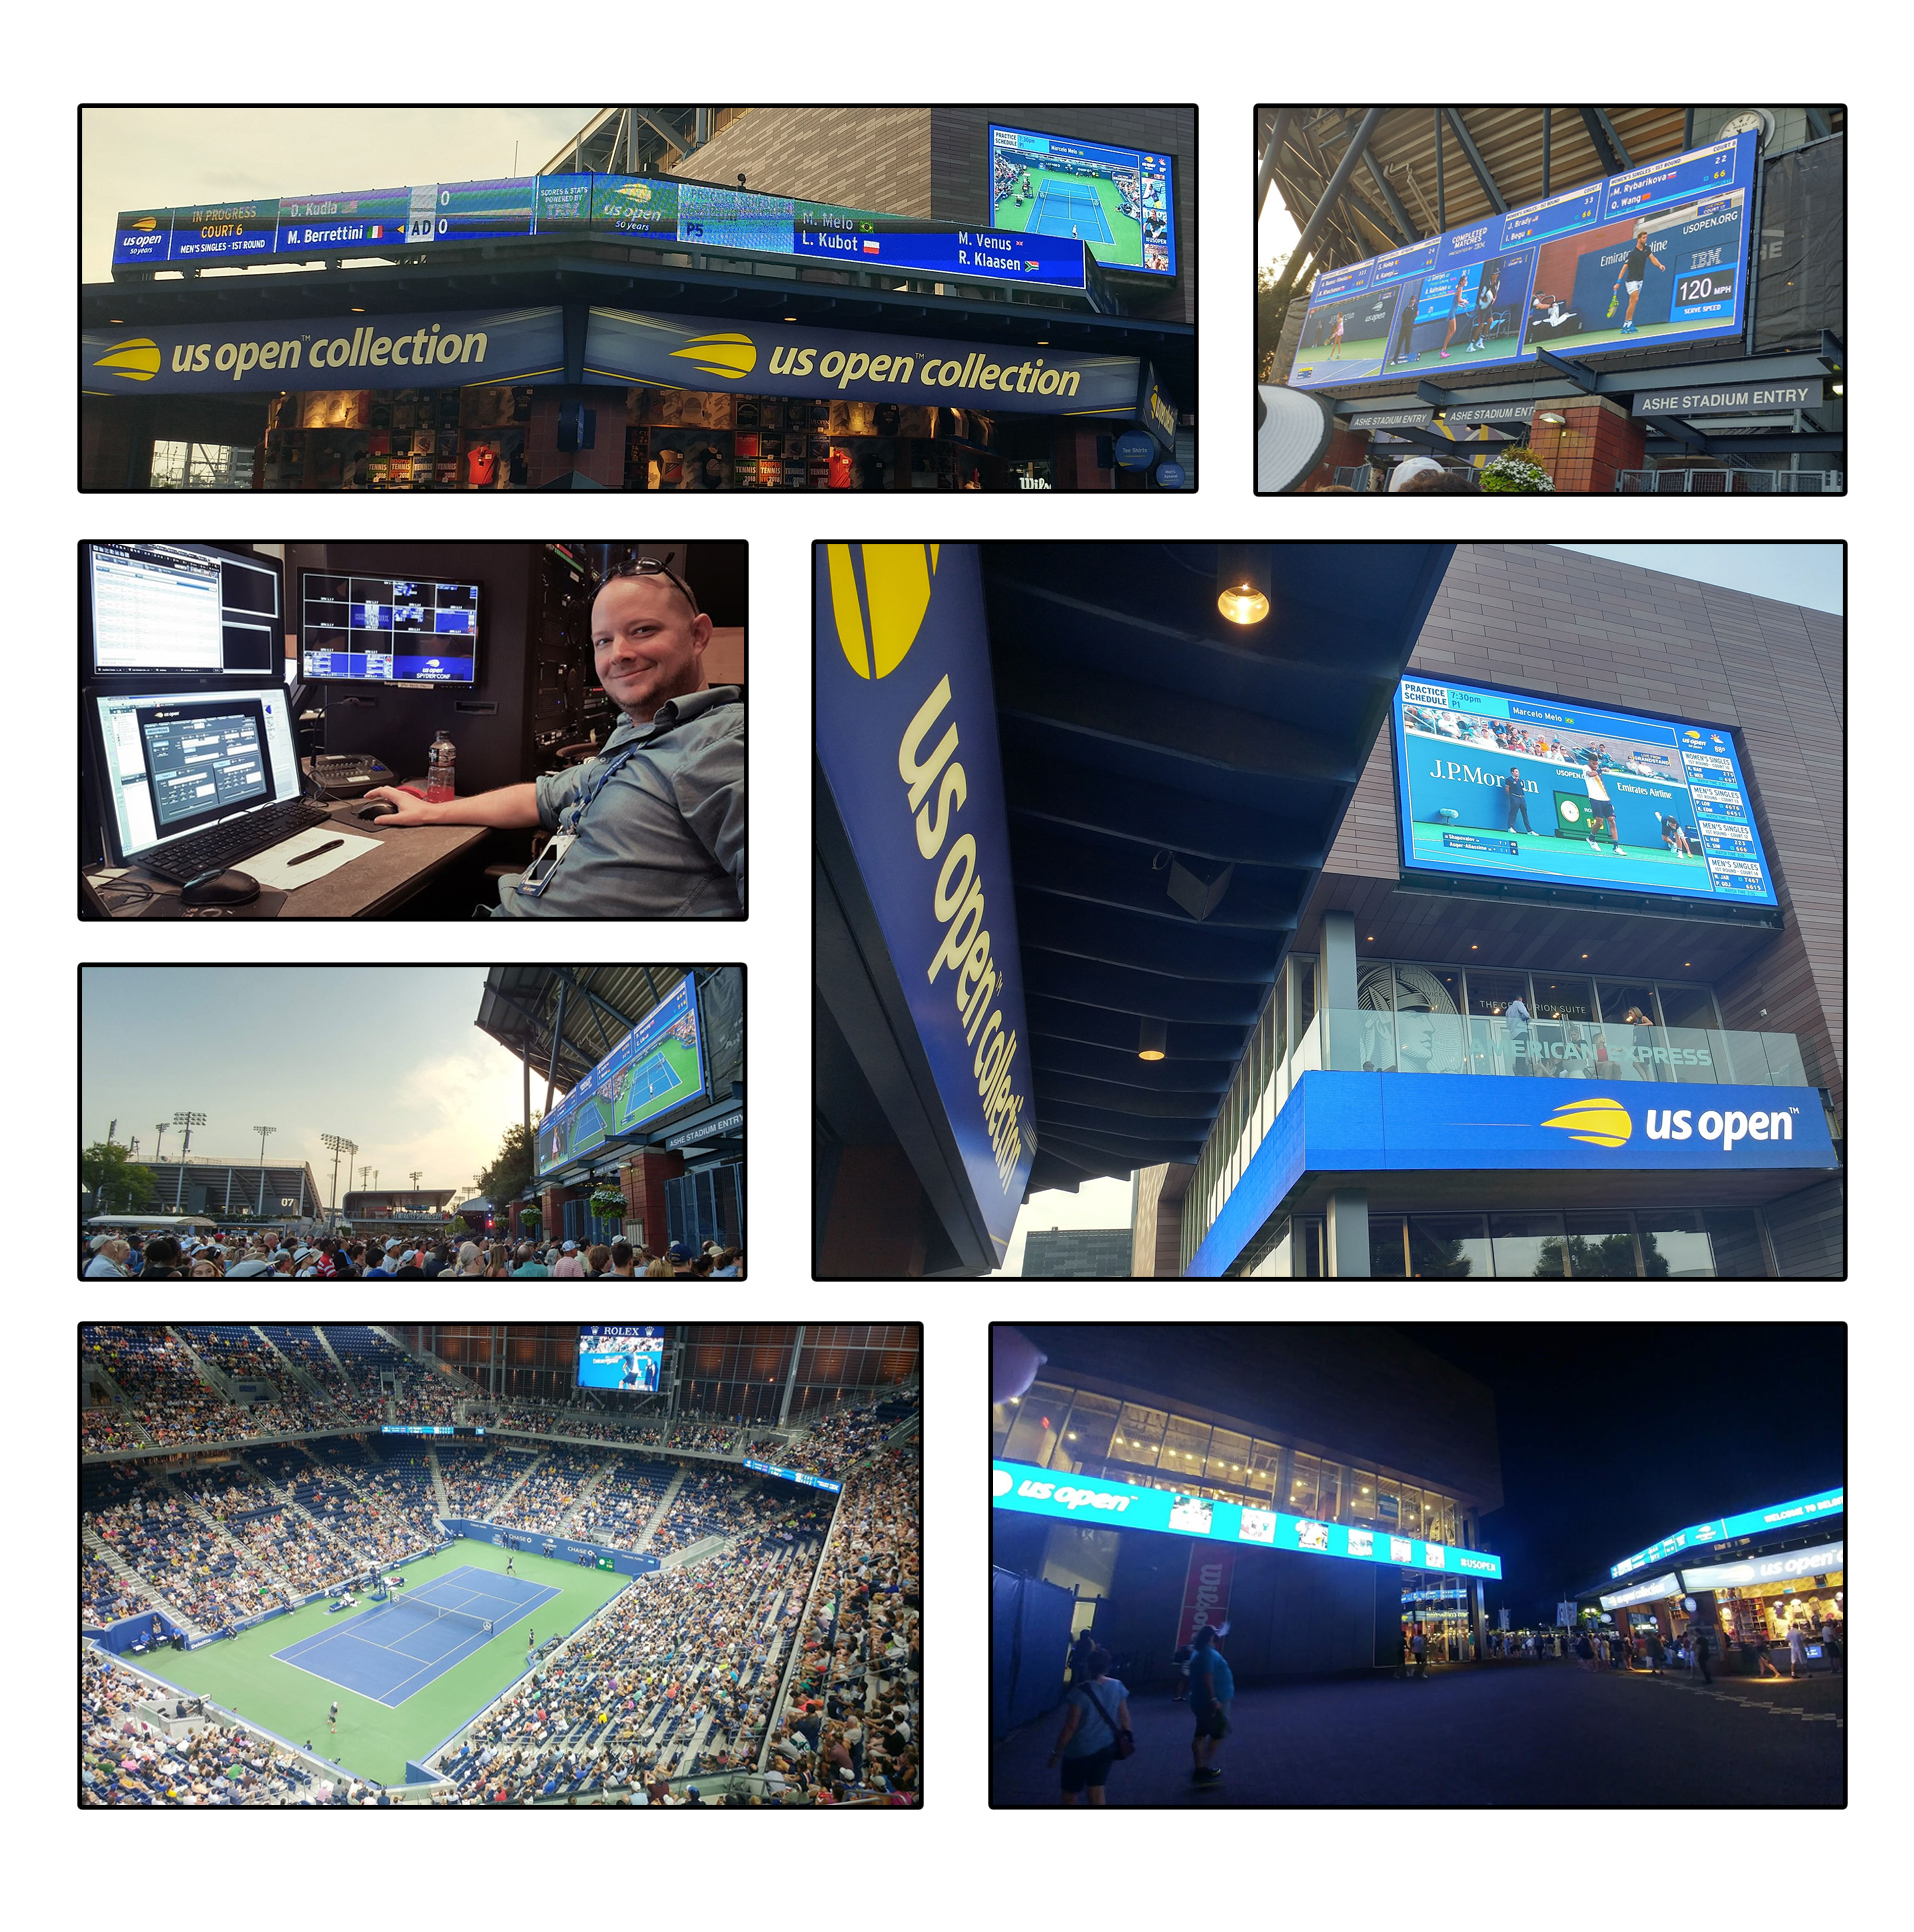
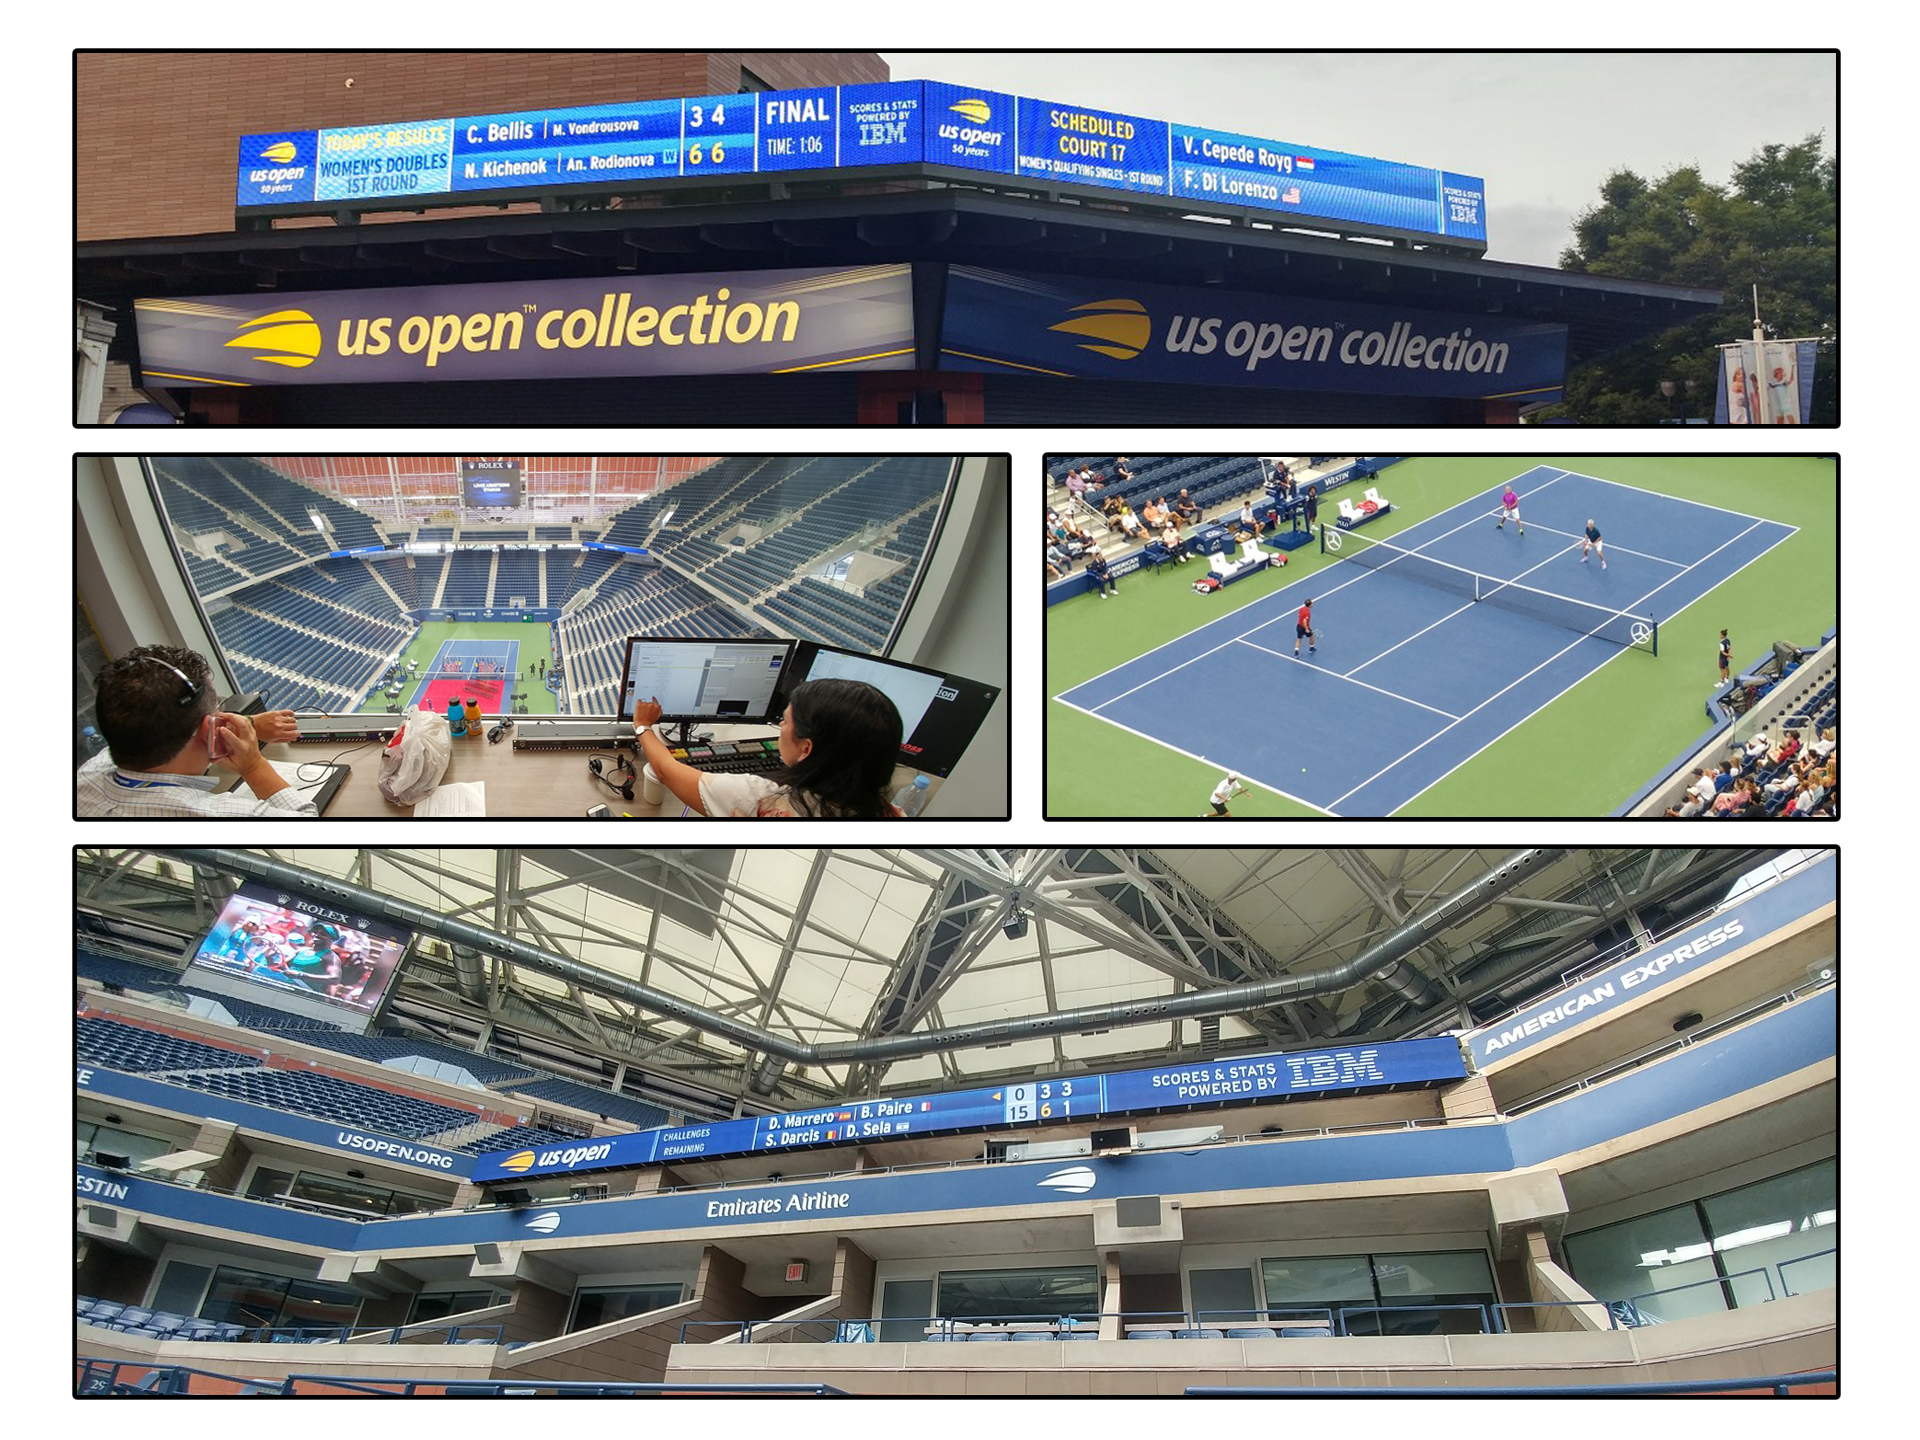
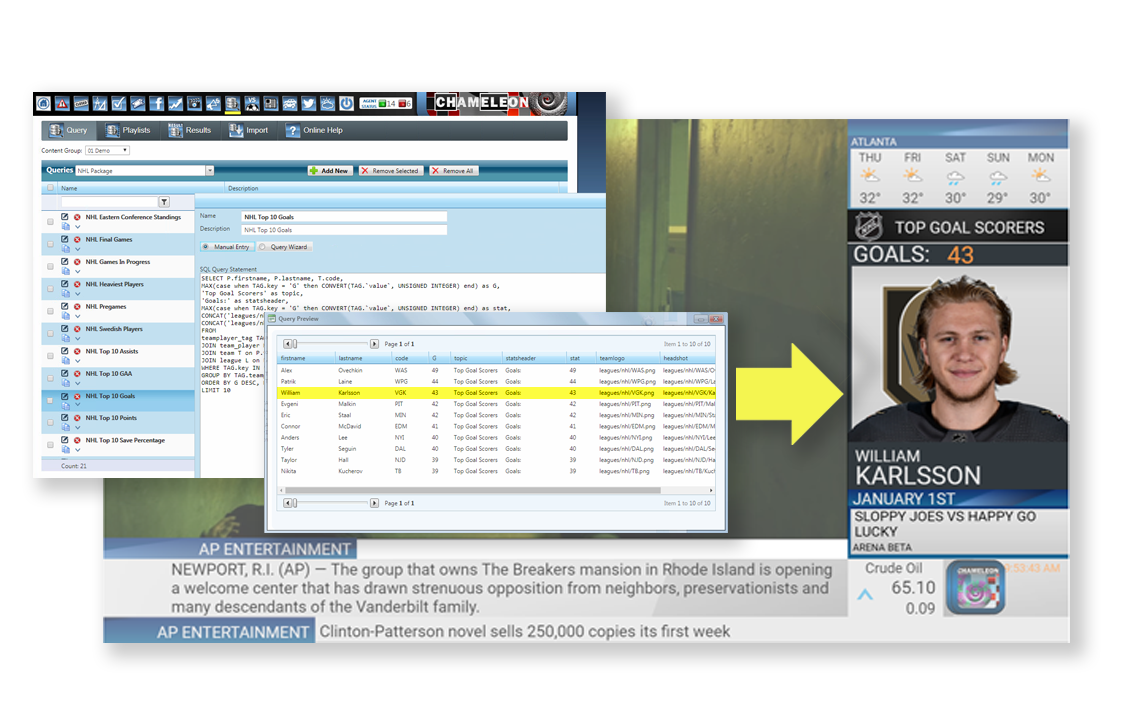
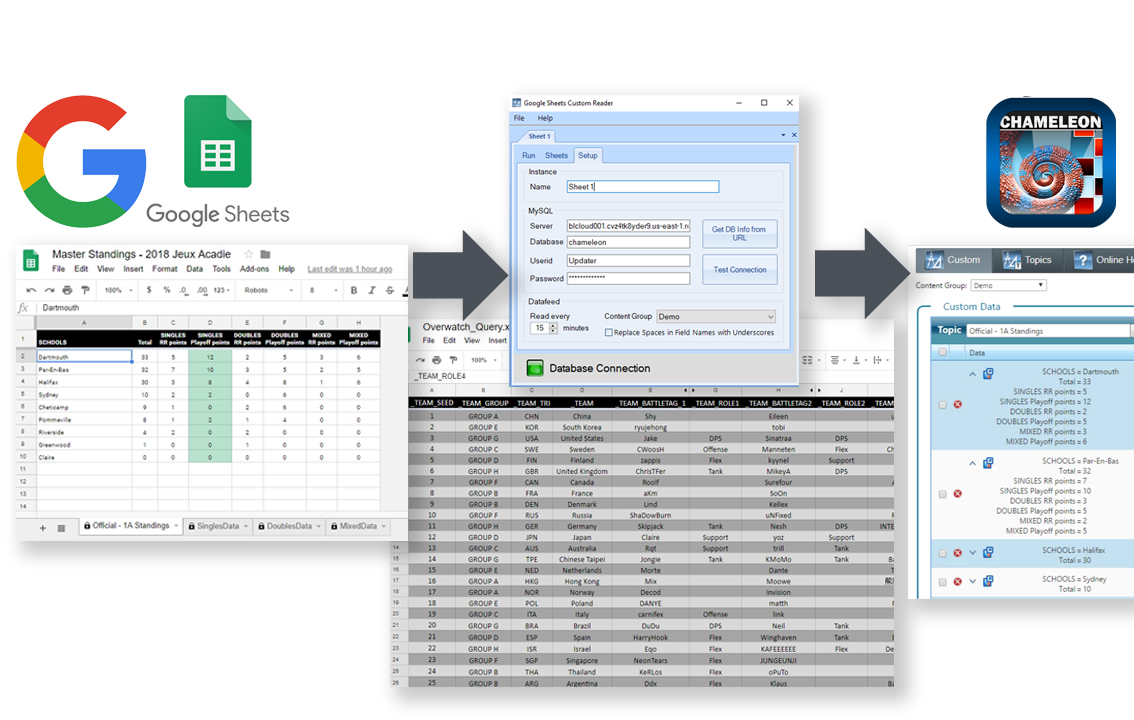
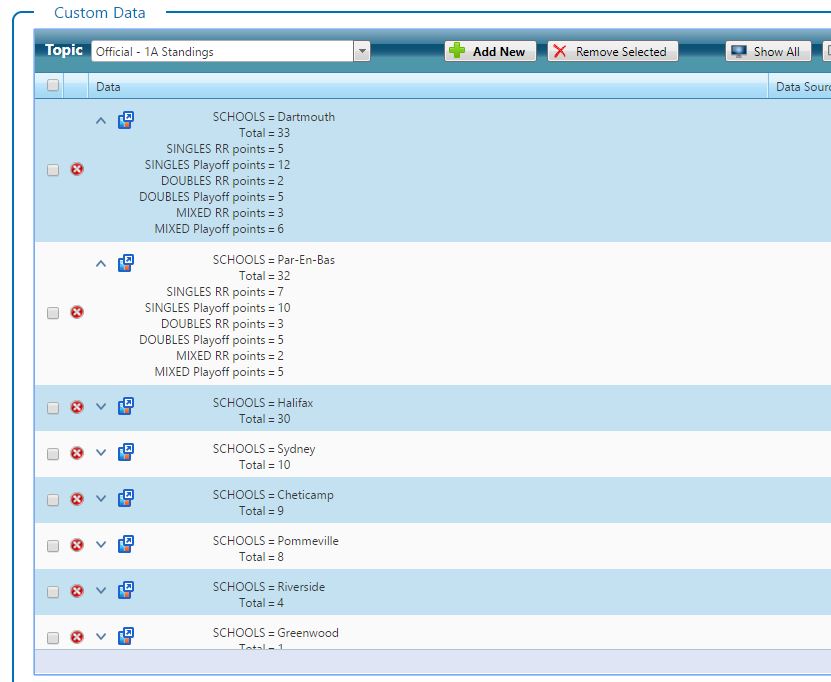
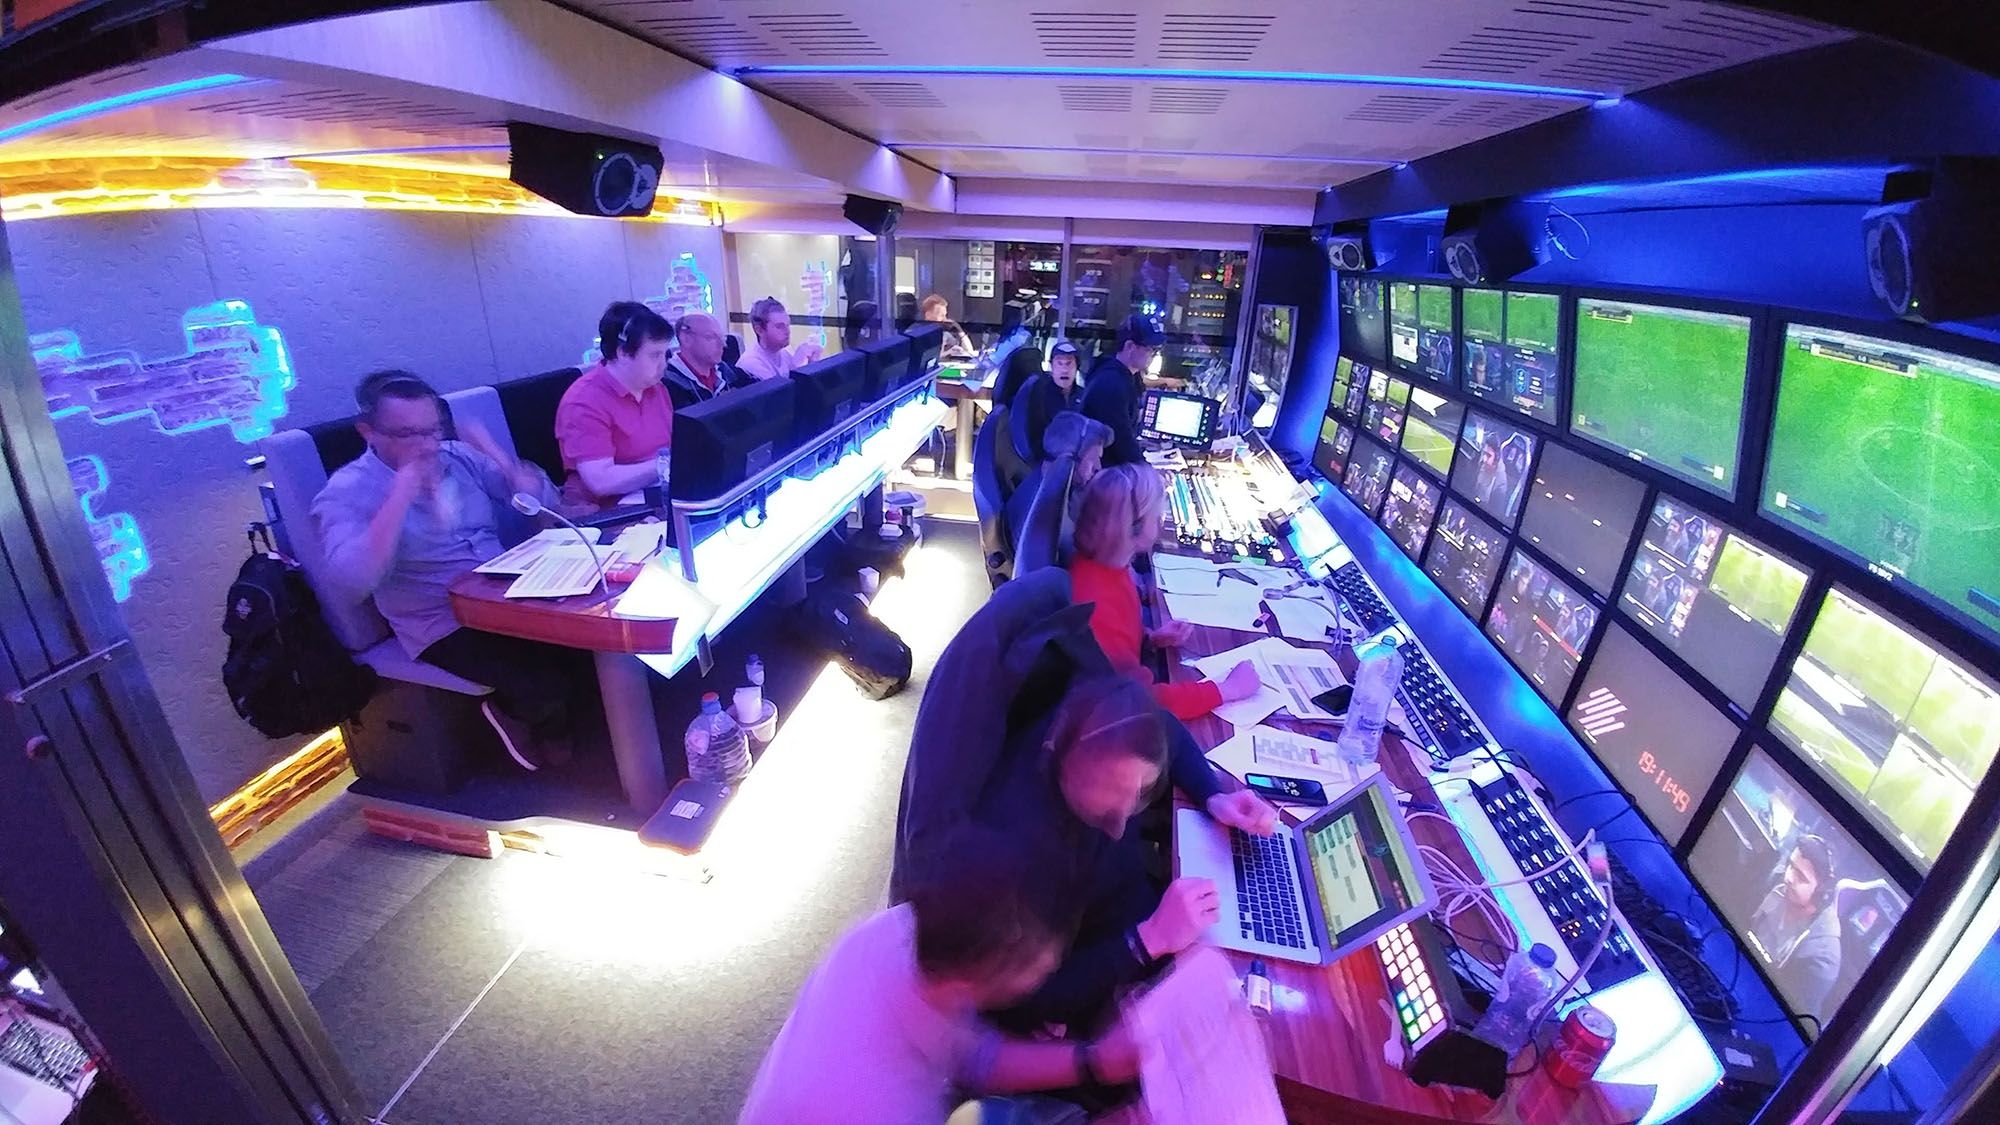
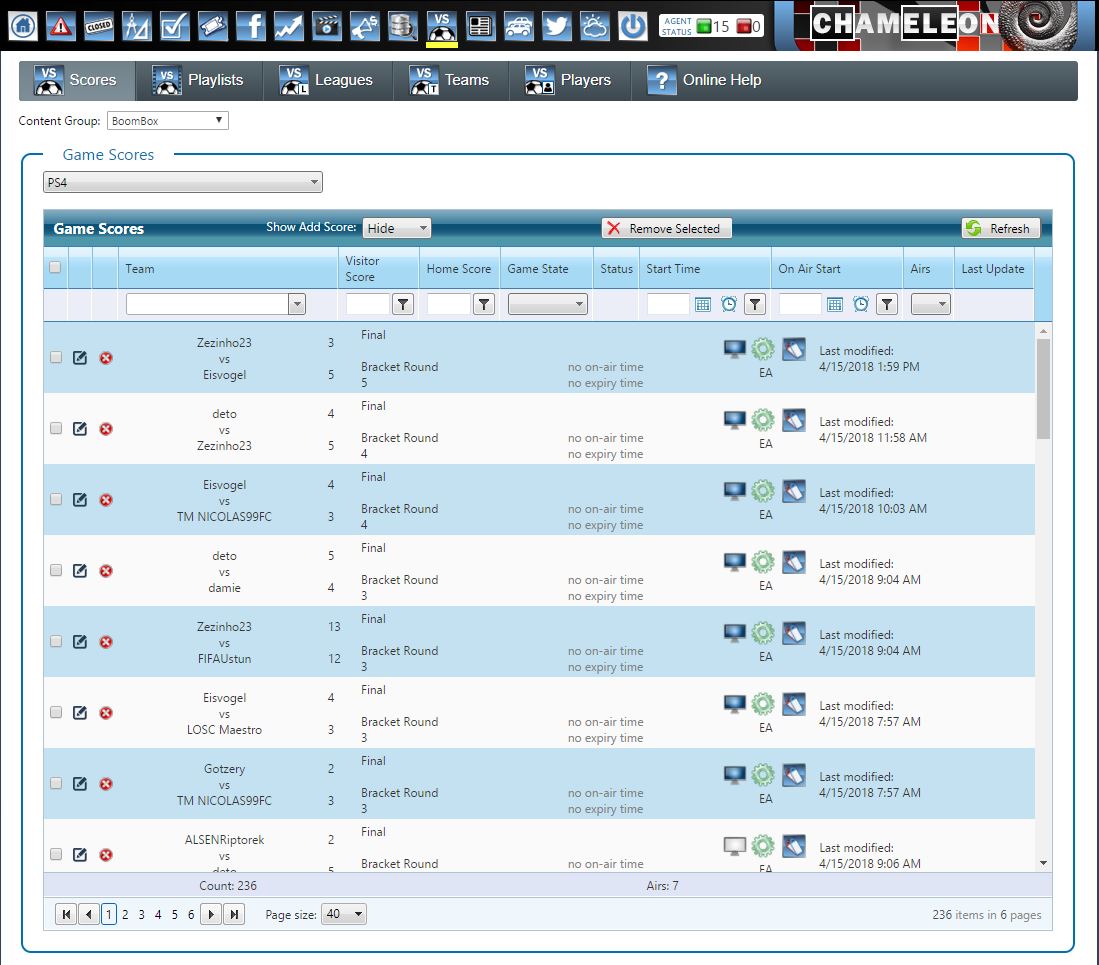
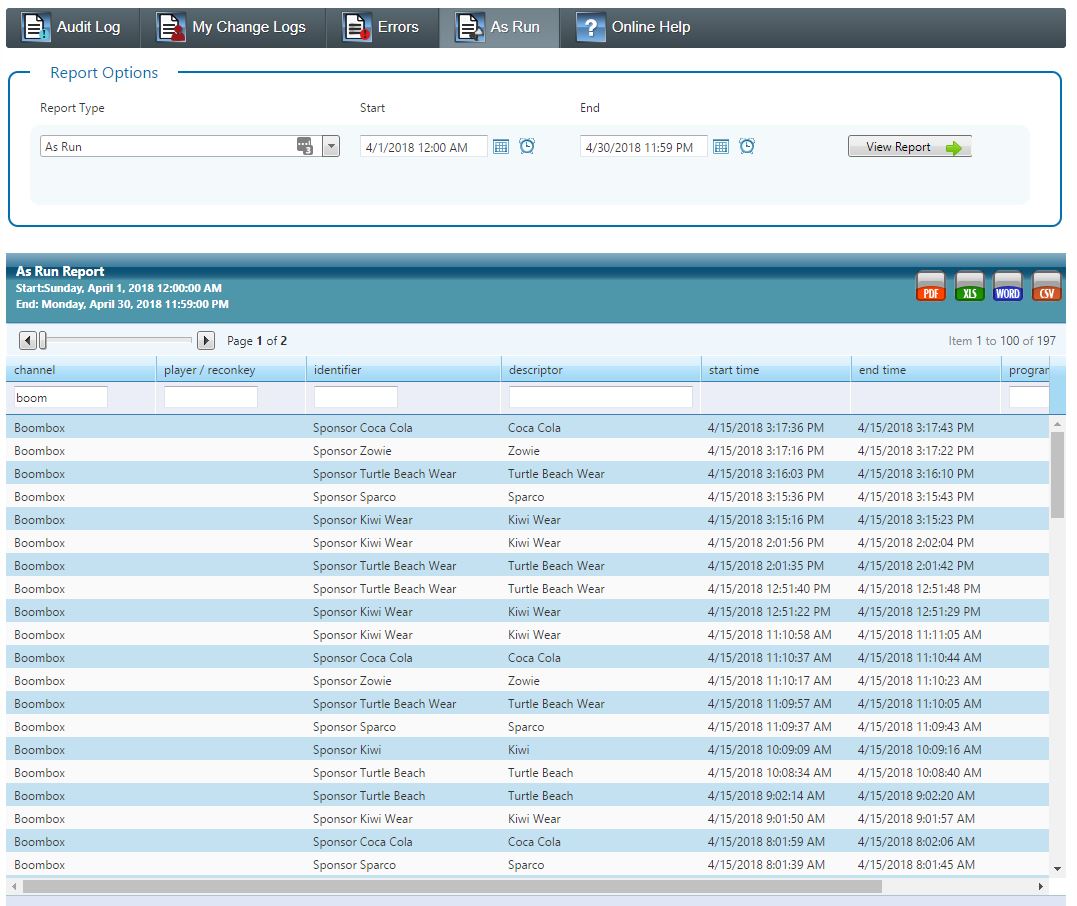
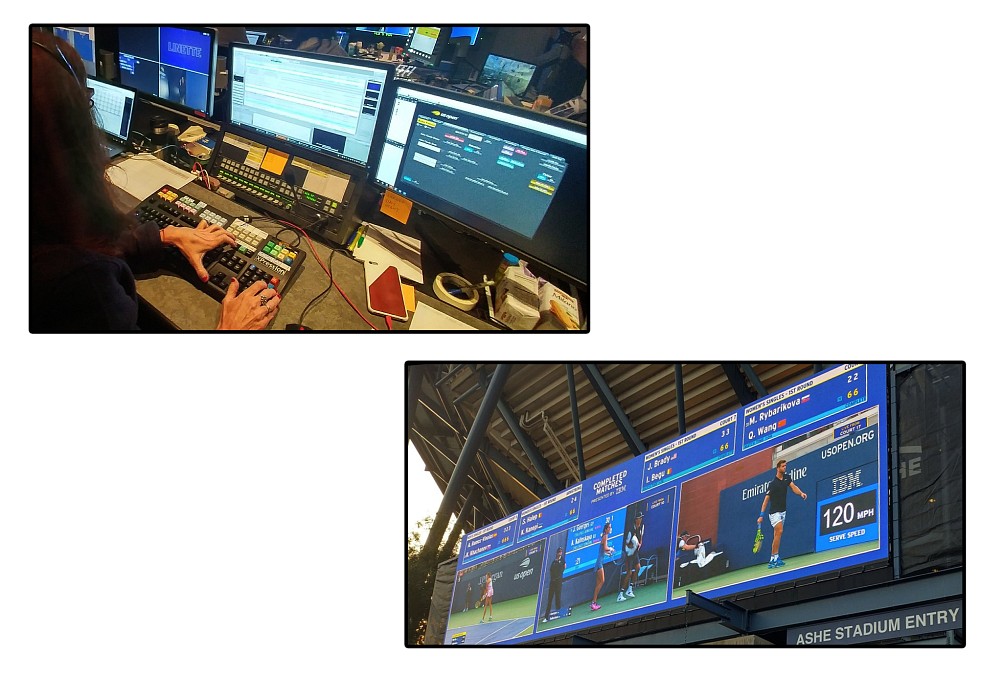
Bannister Lake played a vital role at this year’s US Open at the USTA Billie Jean National Tennis Center in Flushing Meadows, NY. Bannister Lake’s powerful data engine Chameleon served as the data management solution for multiple data feeds from a diverse set of sources. Chameleon was used to reformat, filter, moderate and distribute data and graphics to dozens of various shaped digital signs throughout the tennis facility. Bannister Lake was instrumental in devising the workflows and processes that handled over 250,000 XML files corresponding to the participation of over 1000 players playing hundreds of matches. The complexity of the project was compounded with Chameleon also taking on responsibility for managing other data sources including weather, event news, social media, schedules, headshots, scores, sets winners, standings and other tournament related data. Player’s personal biographical data such as place of birth, height, weight, handed and others information was also included.

“We knew Bannister Lake’s Chameleon could handle the complexity. It’s the industry’s most powerful engine for aggregating any data type and it’s the only way we could have pulled off the US Open project under the extreme time constraints; that and all the hard work by our team.” said Georg Hentsch, President Bannister Lake.

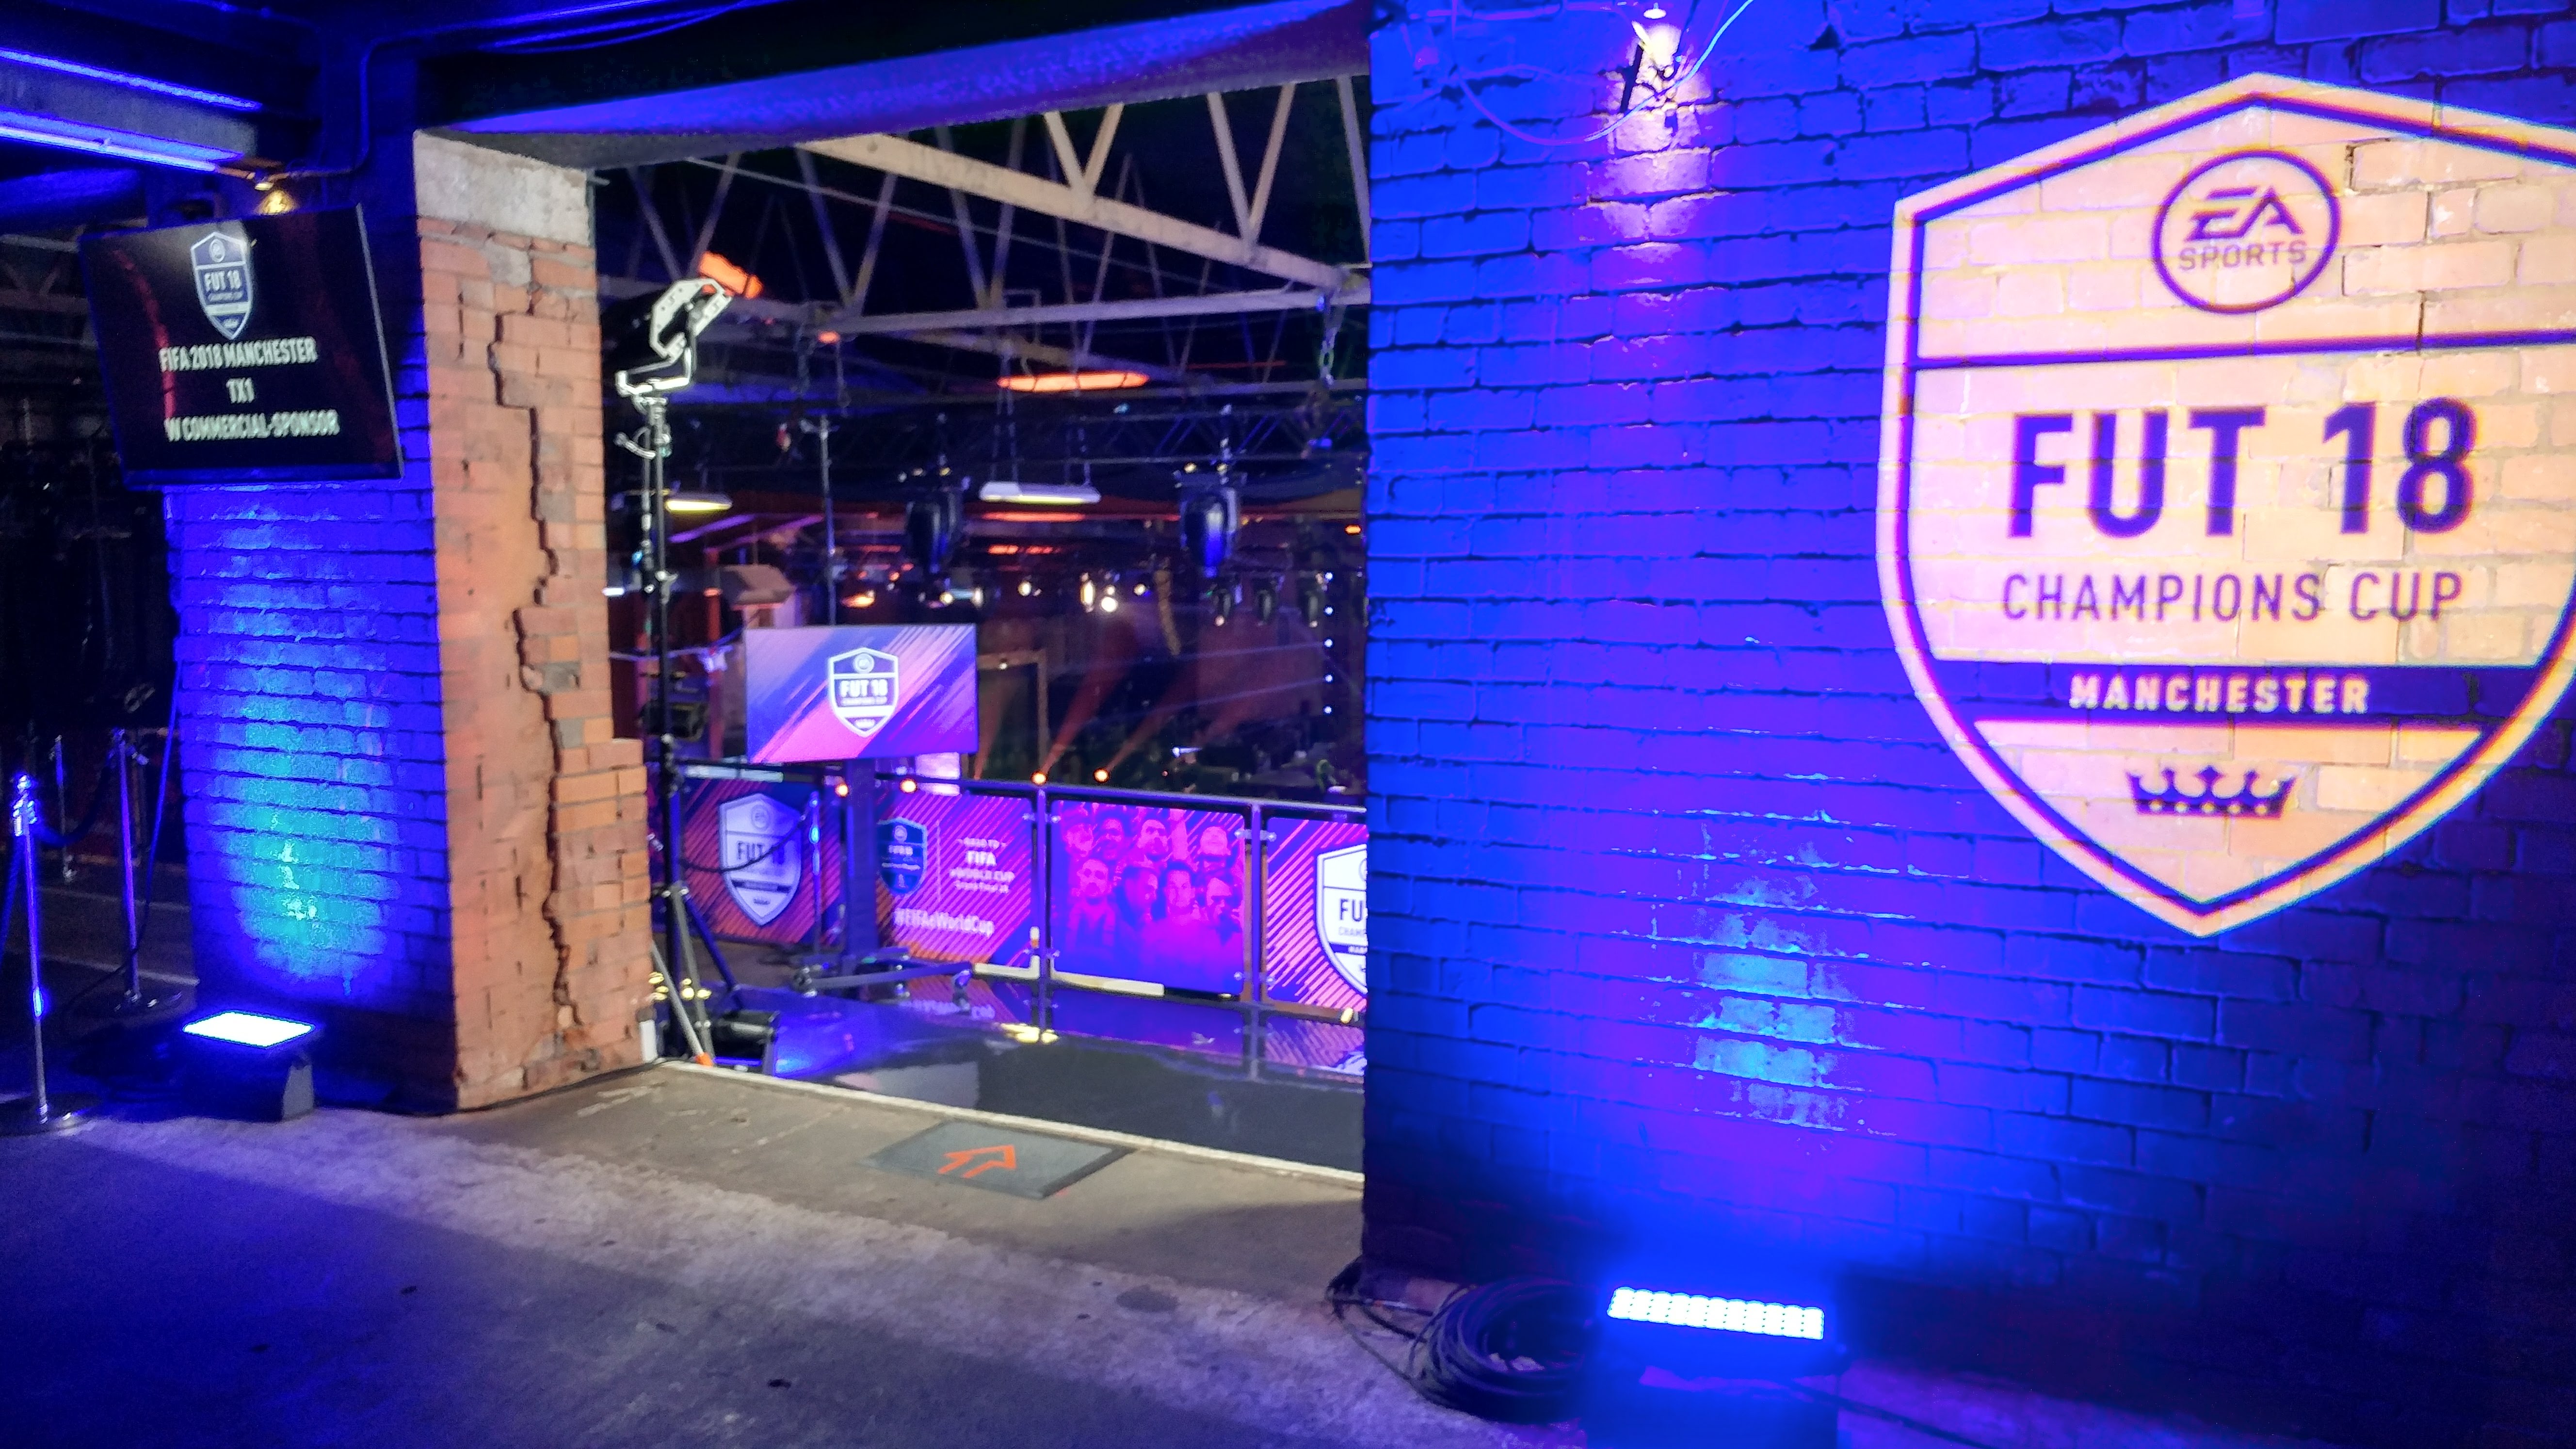
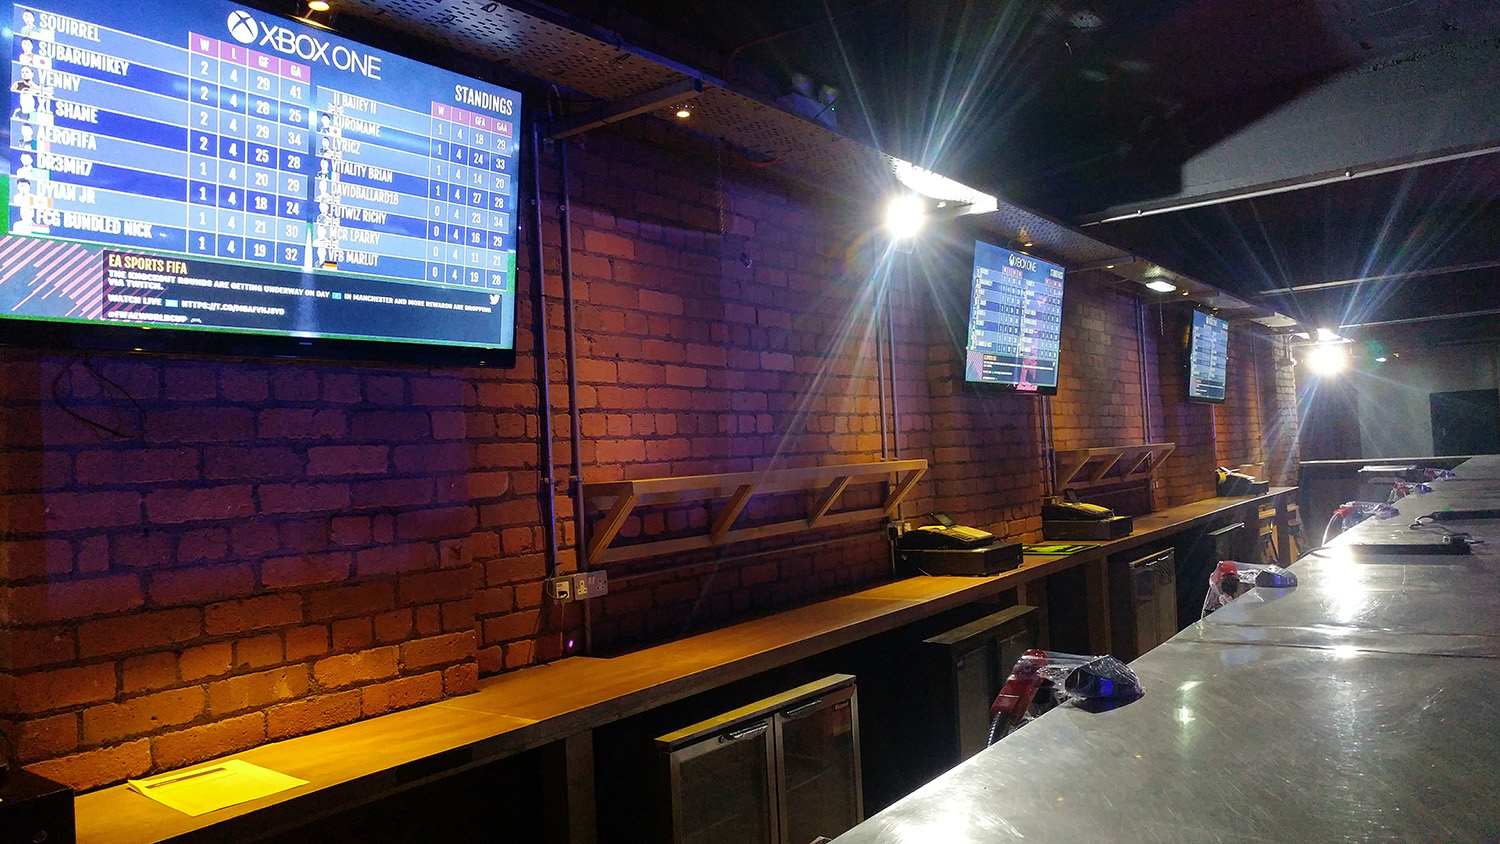
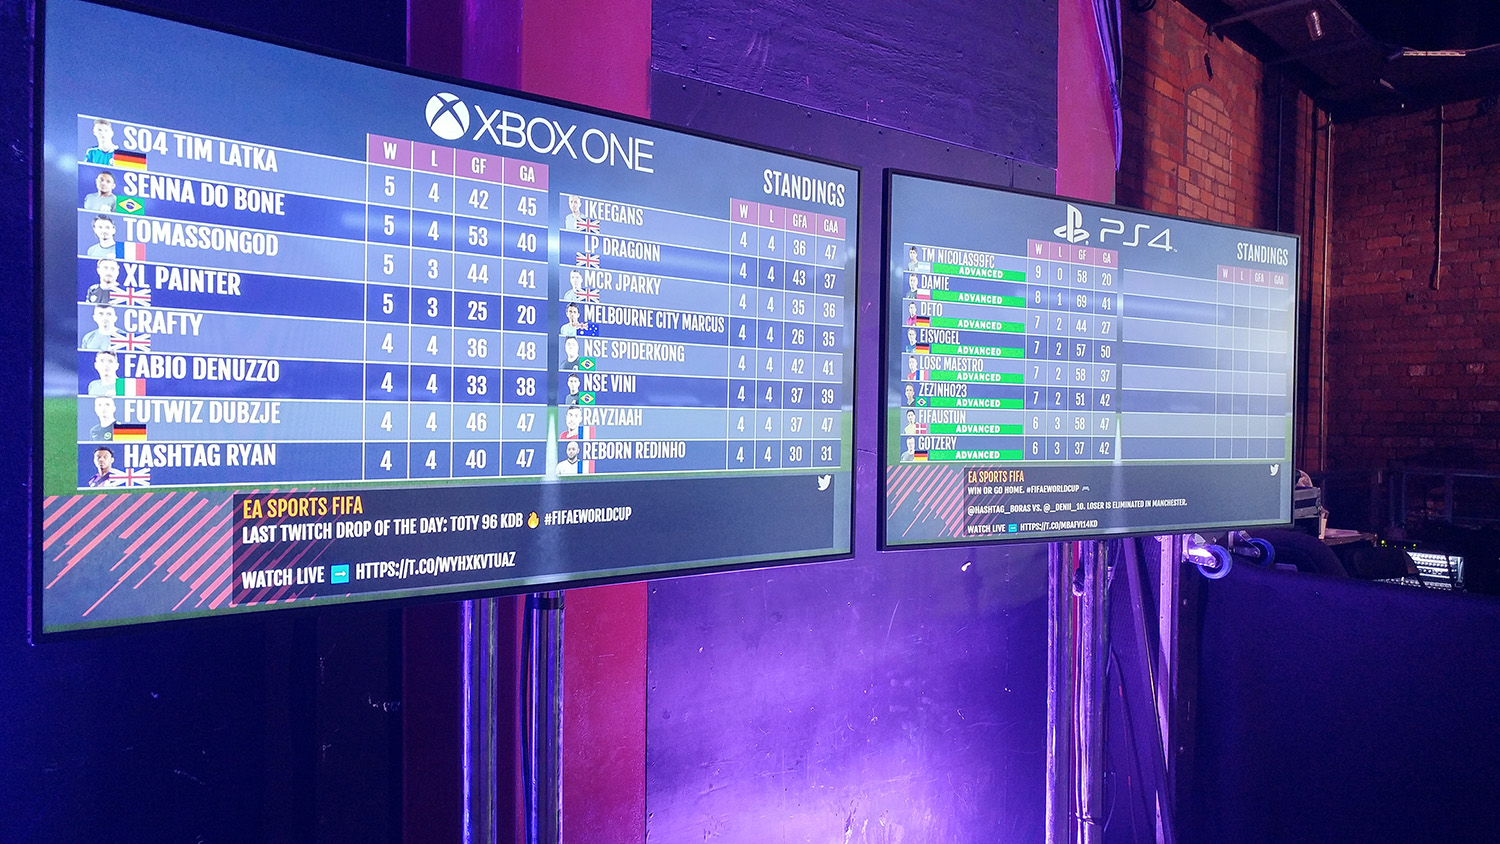
“Our extensive work in both the broadcast market and in eSports prepared us for the production challenges of the US Open. Chameleon has powered a variety of event-based productions, most notably eSports tournaments which typically includes hundreds of matches played over a short amount of time with a large number of players. So, we were more than ready.” said Alain Savoie, Creative and Technical Director at Bannister Lake.

Bannister Lake’s unique workflow was built around leveraging the single Match ID unique identifier which was used to drive all the data associated with a particular match. Chameleon was then able to use automation to populate the various graphics templates and tickers that were in turn distributed via Ross Video’s Tessera and XPression graphics engines to the screens throughout the facility. In total, 7 XPressions running simultaneously with 15 output channels, displaying 15 different screen layout styles were utilized. In addition, 11 tickers running different content on different layouts were also being used.

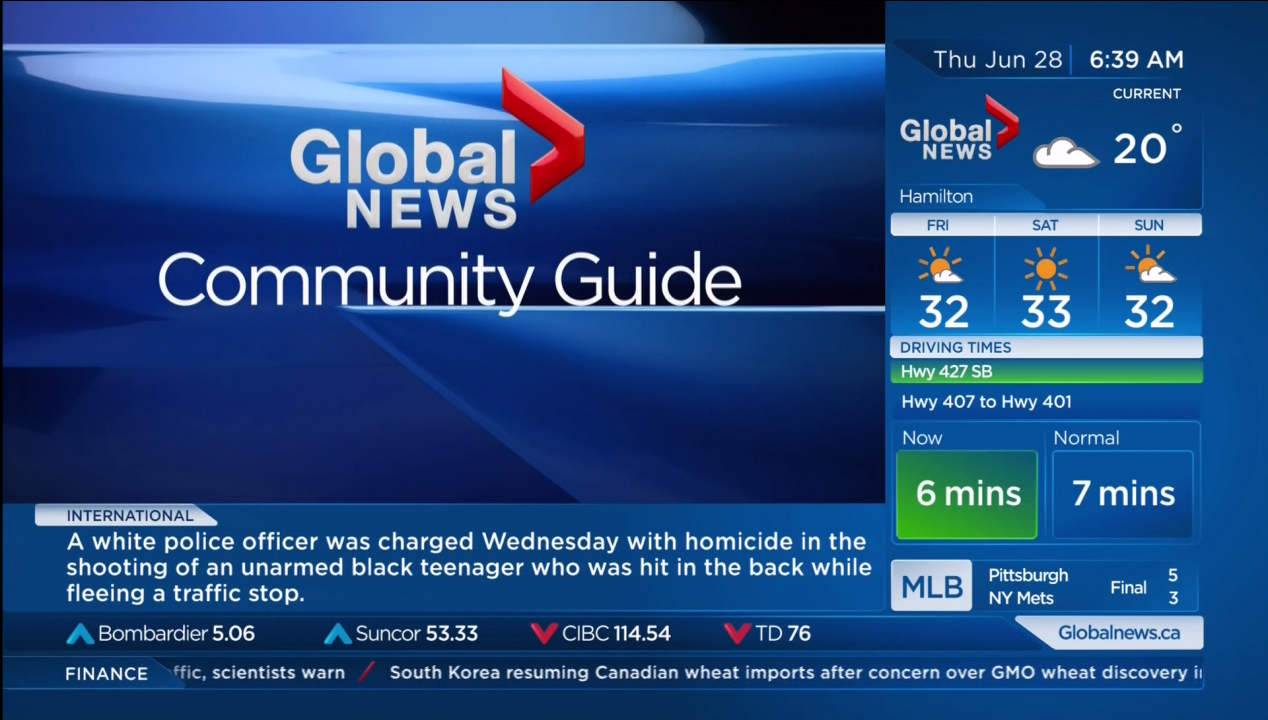
In addition to Chameleon, Bannister Lake provided a complete cloud-based backup system and their unique Community data service. Community allowed editorial and production teams at the US Open to contribute news and essential information to the hundreds of thousands of tennis fans who attended the event.


Bannister Lake’s Chameleon Serving Up Aces at the US Open

The US Open Tennis Tournament at Flushing Meadows, NY is underway and at the heart of the enormous task of managing and visualizing the event data is Bannister Lake’s Chameleon. Chameleon software is handling thousands of datasets, moderating and distributing schedule information, matches, standings, social media, news, weather and more. Cloud backup is also provided by Chameleon.

Data projects of this magnitude require collaboration with multiple partners. Bannister Lake is working alongside Marty Dormany of The Academy of Lower Thirds and the team at Van Wagner Sports and Entertainment. Through the combined efforts of these talented professionals, tennis fans throughout the Billy Jean King National Tennis Center receive live updates and vital tournament information from place-based digital signs throughout the facility.

“It’s one of our largest and most complex projects”, says Alain Savoie, Bannister Lake’s Creative Director. “There are 763 players competing with 899 matches to be played over the 2-week period. Every single game needs the ability to be called up on the fly and include match data and player data.”

Chameleon is not only parsing and managing data, it is also providing the event’s scorebug and ticker solution. In all, 11 different ticker feeds are being generated and feeding various screens around the venue. In-stadium scorebugs are being displayed in the Arthur Ashe Stadium, Louis Armstrong Stadium, and in The Grandstand. In addition to Chameleon, Bannister Lake’s Community data service is being used by production teams to input content.

The US Open signage graphics are being run off 7 Ross Video XPressions outputting to 15 channels displaying 15 different screen layout styles using XPression Tessera and controlled through Ross Video DashBoard. Chameleon’s tight integration with Ross Video products assures operational efficiencies and outstanding performance.

Bannister Lake’s Chameleon with its powerful data engine, innovative parsing, versatile data reformat tools and ease of operation and setup make it the industry’s best choice for complex, mission-critical data visualization tasks.

Chameleon powering digital signage systems at the US Open Grand Slam Tennis Tournament in Flushing Meadows, New York

Here’s the pain point: You need to manage an incredibly large amount of real-time data coming from multiple sources in a variety of formats. All those complex data sets need to be moderated, parsed, reformatted, visualized and then distributed to various screens/devices. Somehow you have to boil all that content down to present a compelling visual storyline that engages your audience. Bannister Lake’s Chameleon product handles this task everyday working with North America’s top broadcasters.

For the next 2 weeks Chameleon is powering digital signage systems at the US Open Grand Slam Tennis Tournament in Flushing Meadows, New York. Chameleon is managing thousands of data files from a diverse set of sources and distributing them to approximately 100 screens spread over the tournament’s four main venues, keeping spectators informed. Chameleon’s powerful data engine, innovative parsing, flexible management tools and ease of operation and setup make it the best choice for complex, mission-critical data visualization tasks.

Getting to the Heart of the Story: Superior On-Air Data Presentations with Chameleon’s Query Functionality

Making sense out of vast amounts of data is a challenge facing anyone involved with the information economy. But this challenge is especially onerous in the world of broadcast television. Broadcasters not only have to retrieve the vital content they require editorially, they then must edit it, moderate it, visualize it and manage its distribution. In a breaking news situation, this process must happen quickly and accurately. As broadcasters launch various companion services on cable, the web, OTT and digital signage, for different audiences and with different revenue models, the management of data content becomes even more complex.

Bannister Lake’s Chameleon software product includes a powerful data parsing tool called Query that provides producers with incredible flexibility and adept data management features. Query allows specific data assets to be identified, modified and in conjunction with BLADE, Chameleon’s RESTful API, be brought into and played back through virtually any graphics engine, including on the web. Bannister Lake developed Query to fully leverage the power of SQL SELECT across its database schema. This functionality allows data-sets to be aggregated, grouped and fully customized providing real time, dynamic results. Furthermore, specific queries can be saved, modified and shared among users across an entire organization, vastly improving on-air editorial, refining workflows and putting content to air. A typical example may be a broadcaster that needs to pull only the National Weather Service data pertaining to potential wildfire conditions. Query can parse through all the NWS data and pull only the data-sets that correspond to specific locations, temperature, precipitation and geographic conditions. BLADE can then be used to bring this data content into a graphic engine, a virtual reality system or a ticker for real-time visualization.

By applying the combination of Query and BLADE functionality, media organizations can insure that their extensive investments in data content tell the best story possible while being comprehensively monetized leading to a greater ROI.

Query of NHL Top 10 Goals

Chameleon: Drive On-Air Graphics Directly from Google Sheets

With Chameleon’s new Google Sheets Custom Reader, media producers can automatically pull data content from Google Sheet cells and populate graphic templates. Producers can take advantage of Google Sheets’ sharing capabilities and have multiple users contributing content. Plus, content can be organized and displayed using the Google sheet tab which automatically provides a topic name for content.

Chameleon’s Google Sheets Custom Reader can handle multiple sheets and tabs providing an efficient and simple way to display complex graphics for broadcast, signage and web. It’s an elegant way to present sports scores, ESports content and News tickers.

Chameleon is the industry’s most advanced broadcast data engine providing users the ability to input any kind of data to populate and manage graphic templates.

Bannister Lake’s Chameleon: From Branding to Tickers, The Industry’s Single Solution for Data Driven Graphics.

Broadcasters everywhere are recognizing the revenue opportunities,operational efficiencies and cost-savings that can be realized by fully leveraging data. Television stations, networks, OTT services, digital signage networks and other digital media operations use data in two distinct ways; to manage internal operations (traffic systems, advertising accounting systems) and to visualize specific content on-air (news, weather, sports, promos). But connecting the two and in turn creating, administering and monetizing graphical content associated with data has always been a challenge.

Bannister Lake’s Chameleon resolves the complexities of data-graphics co-ordination by providing media organizations with a single powerful solution for managing, visualizing and distributing any data type. Chameleon combines the features and capabilities of two of Bannister Lake’s previous products, Super Ticker and Brando, to create a powerful solution that is both data and playout agnostic.

Bannister Lake takes the position that no matter if the requirement is displaying live news tickers, presenting election results, running snipes or the strategic co-ordination with a station’s traffic system, a single solution can and should provide all the necessary requirements to use data efficiently and productively.

Though playout agnostic, Chameleon extends its tight integration with Ross Video XPression and improved support with XPression Project Server including automated deployment, ensuring all systems across the network have the latest, up-to-date, graphic templates.

Chameleon provides full “as run” logs for promos and sponsorships with a variety of support specifically for campaign tracking including the ability to track and account for promos and sponsorships throughout the broadcast day.

Chameleon’s Query function provides broadcasters with the flexibility to use data sources in exciting new ways to create rules governing the playback of content. Stations can leverage a variety of external and internal data conditions to determine if and when branding and sponsorship content should appear on-air. For example, a soft drink snipe may only appear when the temperature reaches a certain threshold, or a special baseball themed offer may only appear when the home team has won the game. Query also allows media organizations to co-ordinate and trigger other related content alongside sponsorships and promos to drive new revenue. A commercial for a car dealership could automatically trigger a snipe promoting a new program sponsored by the same car dealership. Using Query broadcast sales can create premium sponsorship offers that are targeted or co-ordinated with specific events.

Complex co-ordination with multiple media outlets is made easy with Chameleon. As a single software solution managing centralized data, advertising and promos can be strategically positioned to help audiences migrate to various companion media properties. This creates new revenue possibilities by organizing and managing campaigns across several different media channels.

Chameleon’s ‘Tag Time’ feature allows media organizations to leverage data and templating to update and position promos strategically. Tag Time automatically places promos at pre-planned spots during the daypart to pull audiences into primetime.

Chameleon from Bannister Lake is the industry’s only “one-stop” solution that transforms any kind of data into graphic content that can be used on the widest variety of editorial, branding and sponsorship applications. With features that drive new revenue and simplify operations, Chameleon provides media organizations with a path to new revenue opportunities and cost savings while executing flawlessly on-air.

About Bannister Lake Inc.
Bannister Lake is a leading provider of professional video graphic display solutions for broadcast television, cable, satellite, audio/visual and information presentation applications worldwide. Our solutions integrate seamlessly with your existing infrastructure while automating the integration and display of external data sources, improving the productivity of your organization.

Bannister Lake Chameleon powers The Morning Show on Global News

Bannister Lake Chameleon plays a key role delivering real-time content for The Morning Show on Global News across Canada. Chameleon manages News, Weather, Sports, Traffic, Finance and Promos for playout, ingesting and managing everything from international news to local sports scores for regional playout.

Global’s use of BLADE, Chameleon’s restful API, enabled their technical and creative team to deliver a compelling localized on air presentation for multiple locations.

Chameleon delivers live content for RossVideo XPression, Vizrt, Chyron, Pixel Power, ClassX, Imagine Versio and many other broadcast graphics platforms.

Global News Morning Show

Smile with an Emoji!

Emojis

Bannister Lake has been hard at work the last few months.   Our Election software was used during the Ontario elections at 3 different Networks (Global TV, TV Ontario and TFO); we took part in an eSports playoff series for EA’s FIFA World Cup; Branding is fully integrated inside Chameleon, making Chameleon an even more powerful tool in production.  

EMOJIs… 

One of the features that has always been available with Chameleon and it’s rendering engine, is the ability to display globally supported Emojis.  Often found in Tweets, emojis can also be added to news stories.   An example is this: 

I’m 😊 today because it’s ☀ outside.  The 💐are blooming and 🐦 are chirping. If only my 👨‍👩‍👧was here with 🤷‍♀️

gets translated to this on output: 

This has been a requirement for production personnel for years, since most CG broadcast systems don’t support it.  But with Chameleon Web, it works without having to do anything.  

To add an emoji while typing, simply Press Win + period (.) or Win + semicolon (;)  in Windows 10

Custom Content Type

Custom has been added to Chameleon a while back as a content type, but until recently, only available as a blade output.   Now, Custom is part of our rundown output, which means your ticker can include virtually any type of formatted content.  

One example for our demo is a list of recipes you may want to cycle through. 

Another very useful way to use Custom is with google sheets. One idea is when you want to display results from a sports tournament, and the tournament officials are using Google sheets to order their round robins or playoff brackets.   Google sheets can import the various visible tabs and automatically create custom results with the appropriate tags. 

For more information on the reader, go to our wiki page. 

Query Sponsors

Branding has now been integrated with Chameleon, making it easier for users to add some branding assets to their workflow.   But a major bonus that comes with the integration of branding with data, means that you can create conditional branding assets.   

As a simple example… maybe you create a house ID for your broadcast that will showcase a sponsor based on the type of weather in your area.  

Note in the image above, the Demo Assets Sponsor Banner was selected as the template, and a Query Weather Sponsor was given as the HouseID/Name.   But additionally, we picked “Query Sponsor based on Toronto Weather” as the condition. 

The conditions you see in the query includes: if Clear, show a RayBan sponsor.  If Cloudy, show Diesel wear sponsor.  If Rain show umbrella sponsor.   Coincidentally, in Toronto at the time of writing this blog, it was ‘none of the above’.

This feature allows you to create an unlimited amount of conditions.  If you’re in a major city with a major sports team, and that team wins a title.. your promo banner could have a related sponsor.  But if they loose that title/game, then automatically another promo banner would appear.  

And with Chameleon’s vast data collection, you can come up with anything to display at any time.  

EA’s eFIFA FUT Amsterdam


The final leg of the eFifa FUT Global Series playoffs took place in Amsterdam over 6 days at the end of May.  128 players from around the world competed against each other for a chance to not only win this tournament, but to qualify for the FUT Grand Finals taking place in London in early August. 

Once again, Bannister Lake was called upon to provide moderated data for in show broadcast, and the venue’s digital signage. 

Since the tournament took place over 6 days, the requirements weren’t as complex as Manchesters’ tournament.  In Manchester, both Xbox and PS4 games were played at the same time, whereas in Amsterdam, only one console was played at a time.   This of course, didn’t diminish the quality of the production, but allowed us to focus more on the individual players and games. 

The biggest achievement in my opinion comes from this; A typical hockey, or baseball, or basketball or even soccer/football game, has your typical production crew.  A mobile truck, with a couple dozen camera feeds, 3-4 EVS operators, Technical Director, CG operator, Audio A1 and a couple A2s, a Stats producer, Associate Director, Director and Show Producer.  But for those broadcasts, it’s still a single game, taking place over 2-3 hours.   An eSports tournament is hundreds of games with hundreds of players over 8-10 hours, but the broadcast demands and requires the same quality output as your single game/2-team format.    

Some stats to ponder:

  • over 60 Xpression graphics templates built, linked to data provided by Chameleon
  • 472 games played during this Amsterdam tournament, with 10 different stats per game
  • 128 players, with 8 different individual stats per player
  • archived stats from Barcelona and Manchester totaling 944 games with 256 players
  • 2 Xpression operators, with 4 channels of output.
  • 2 automated Chameleon L-Bars (one with and without sponsors)
  • 2 automated digital signage feeds for in-house signage (Xbox and PS4 content)
  • exclusive news feeds content, entered by the talent and EA’s social media team 

With eSports broadcasts being produced more and more, with viewership increasing over the million mark, production demands will require things to be extremely efficient.   Chameleon is just one of those tools that help make something like this possible.  

Integrating the Chameleon into our Productions has super-charged the amount of info we’re able to communicate to our audiences.  For the past 2 seasons we’ve relied on the Chameleon architecture to power our onscreen info-graphics.  The system itself is very straightforward to integrate; Producers and Talent are able to update it in the heat of the action and most importantly –  using Chameleon has resulted in better storytelling, and more flexibility in how we tell those stories.


TJ Walker

Boombox Group

Head of Production

Bannister Lake wishes to thank Boombox Group for choosing Chameleon as their tool of choice for displaying and moderating the tournaments’ data. 


EA’s FIFA eSports Manchester


The 2nd leg of the eSports FIFA eWorld Cup Tournament took place in Manchester Apr 13-15 2018.  Once again Bannister Lake was hired by Boombox to assist with aggregating and moderating stats for the tournament using it’s powerful Chameleon platform.  This time around however, Chameleon was truly tested to its full potential. Like the previous tournament, Chameleon was used as the central platform to aggregate data from game ops who entered in tournament scores and stats.  This includes individual player stats (games played, wins, losses, goals for and against, GFA/GAA and win order) and individual game stats (Games 1/2/ET/PK results, goals/shots for player 1&2).  And like the previous tournament, these stats were feeding 2 Ross XPression character generators to populate player and head to head boards throughout the tournament. This was done by using Chameleon’s restfulAPI Blade and Chameleon’s query module working with XPression’s datalinq tool using datalink keys.  This method allowed for the operators to enter a player’s name in a search box, which in turn called up all the players stats.

While Chameleon was responsible for populating templates in XPression, Chameleon’s own rendering engine was used during the tournament as well, in a form of an L-Bar.   In February, this L-Bar was used exclusively to showcase stats, social media and news items to the viewers, but this time, we’ve added a feature to display sponsors.

Because of Chameleon’s ability to provide AsRuns, we integrated the sponsors to be displayed on the L-Bar itself and scheduled the sponsors to appear on-air at a specific time during the day using Assets Schedule.  If the L-Bar wasn’t on-air during that particular time, we used Chameleon’s Switcher app to trigger the sponsor manually as well. At the end of the tournament, we handed off a PDF of the played sponsors and their duration on screen, providing another element for the production.

In February, the production and social media staff also used Chameleon to enter news stories and filter social media entries.  Like in February, the news entries being entered were used as an exclusive gateway to viewers watching, as oppose to simply relying on social media.  Only viewers of the show were exposed to in-depth analysis and on the floor reporting. The influencers and casters were responsible for entering anything they heard on the floor (using an iPad) and the social media team were responsible for approving those stories before going to air.

Some new moderation features were added to Chameleon to assist with production to easily search and filter through stats.   One in particular was Query Results which was used on air with talent to call up specific results. The host quizzed some of the casters with questions based on Chameleon’s queries, including top 10 goals-for players in the tournament, top 10 goals-against, and top goals-differentials, to name a few.  

This wasn’t enough however, as Ncompass, one of two clients during this tournament, requested another feature be provided throughout the tournament in a form of digital signage.  Especially used during day 1 of the tournament when 128 players were competing on PS4 and XBOX consoles, the players needed an easy way to see where they were in the standings and who their next match-ups would be.  Using Chameleon’s channels, we provided two individual urls feeds (PS4 & XBOX) which were in turn used on about 16 monitors placed around the venue. Intel PC sticks were connected VIA HDMI with WiFi, and directed to open the urls in Chrome full screen.  


A bonus added feature for digital signage was a countdown clock, informing players of the next round in the tournament, and the ability to trigger announcement and messages using Chameleon’s assets module.   The messages were treated as snipes, able to trigger on/off manually or automatically based on their requirements.

To recap, our single instance of Chameleon, aggregated and moderated 128 players with their stats, with 473 games played, filtering and creating queries for the casters to monitor,  populated 2 XPression systems with dozens of templates, 2 Chameleon L-Bar tickers (one with and one without sponsorship enabled) and 2 separate feeds for digital signage populating over 16 screens at the venue.  All for less than $2,000.

There is a final leg to this tournament coming up at the end of May/June.