Bannister Lake to Showcase Data Management Innovations at NAB Show Driving Election Coverage, Tickers, On-Air Branding, and Infochannels

At the 2020 NAB Show, Canadian real-time data solutions provider Bannister Lake will be focusing on its industry-leading data aggregation and management solution Chameleon and how the product adds value to a wide variety of broadcast, OTT, and digital signage applications.

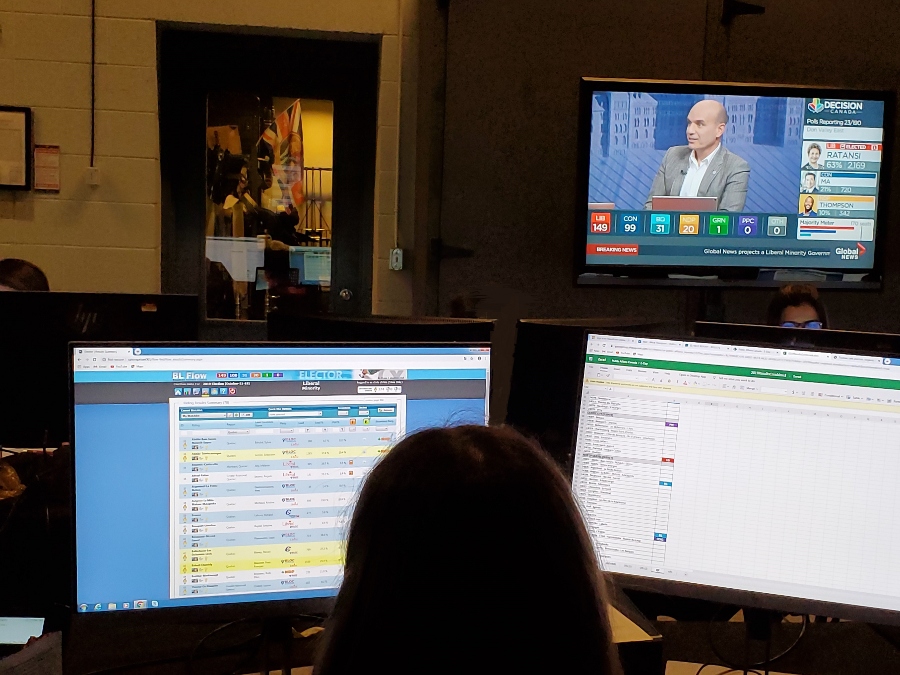
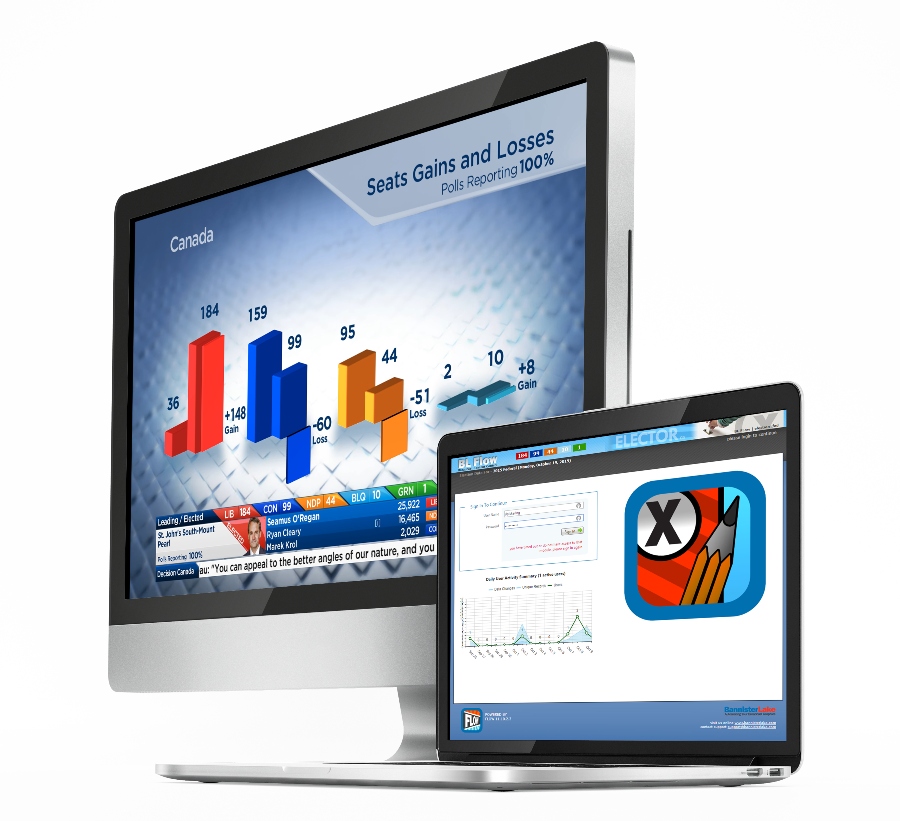
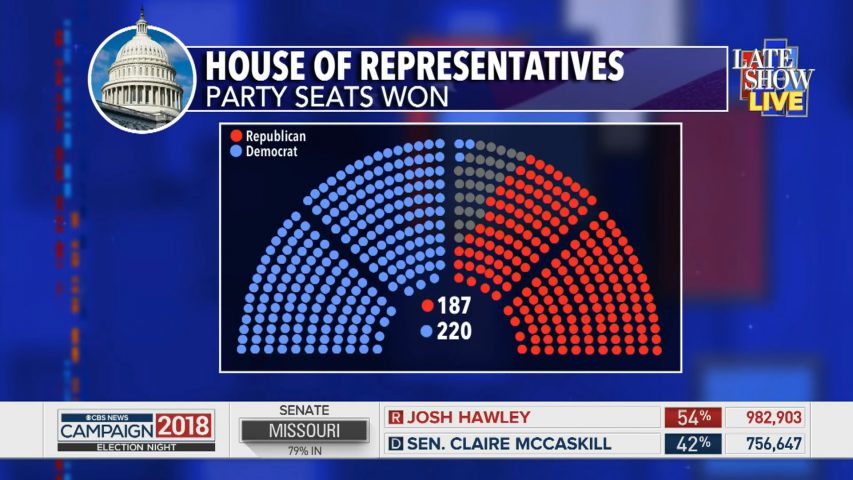
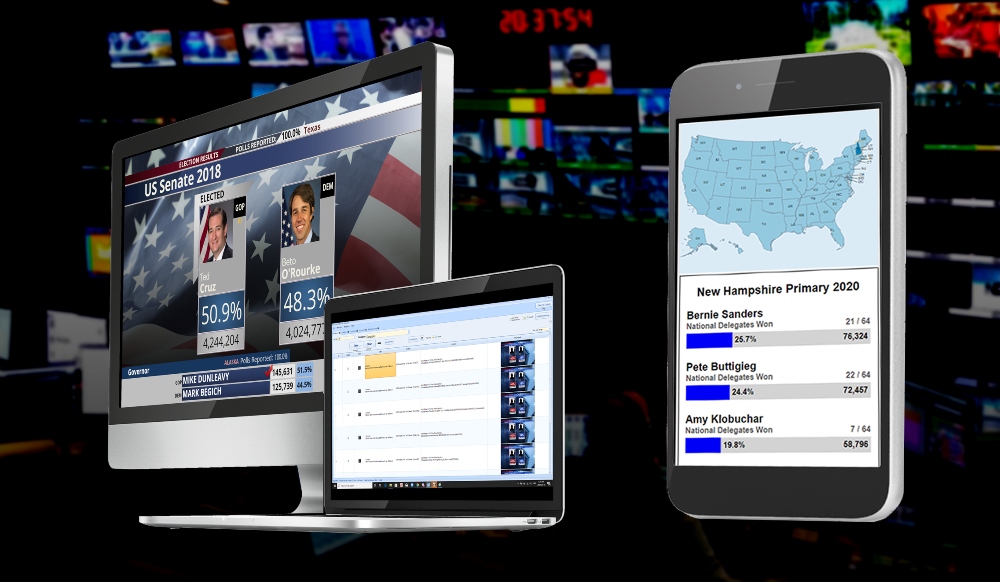
Bannister Lake will be highlighting Chameleon’s enhanced election module ready for the 2020 U.S. election cycle. Media companies can take advantage of Chameleon’s new election features to produce real-time election coverage on any screen. Chameleon reads election results from both the Associated Press and Decision Desk HQ, allowing media to report on up ballot and down ballot races as well as the primaries and caucuses.

Bannister Lake will also be highlighting Chameleon’s ability to fully manage and visualize both live data feeds and on-air branding content for enhancing news productions, sponsorships, and promotions. Broadcasters in any market, using any output device, can integrate, moderate, and customize multiple live data feeds into graphic templates and provide their audiences with real-time news, weather, sports, social media, financial, and fully customized data. In addition, the product’s branding module can fully control sponsor’s snipes, bugs, and other promotional graphic content triggered by the broadcaster’s traffic system.

Automated infochannels will also be in the spotlight at the 2020 NAB Show. Chameleon serves as the foundation to ingest, manage, and visualize an unlimited number of data feeds that can be rendered to any graphics engine, HTML 5, or NDI. Broadcasters can quickly launch infochannels made up of real-time news, weather, sports, financial, event calendars, and other relevant content. To enhance the offering, Bannister Lake has recently added transit and car sharing data to make the channels especially important to local audiences.

As legal sports wagering continues to grow across the U.S., Bannister Lake will be featuring wagering channels covering horse racing, fantasy sports, and other events. Chameleon has become an essential tool to aggregate, manage, and display both sports statistics and betting data. Bannister Lake works with media companies that require a robust solution that can read data from a wide variety of sources and can integrate that data into the on-air presentation.   

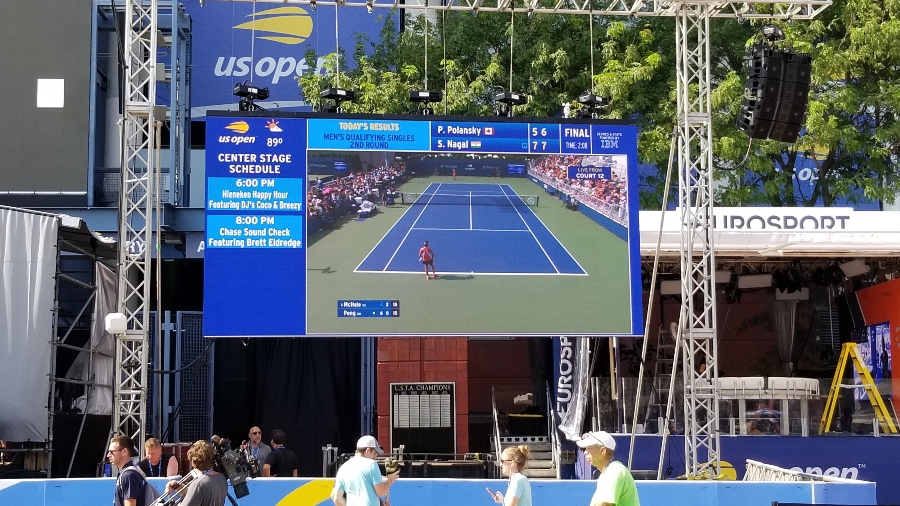
The 2020 NAB Show will also spotlight in-venue, real-time data solutions for arenas and stadiums. More and more venues are realizing that real-time data plays an integral role in delivering content that adds a deeper and more entertaining fan experience. Venues appreciate that advertising- and sponsor-related content has more impact if real-time, game-relevant, insightful data could be tied to the presentation. Chameleon is used to ingest real-time statistical data from the leagues, allowing fans to view carefully parsed live game and league statistics combined with game action. Venues are also turning to Chameleon to develop innovative use cases for real-time data and sponsorships, including graphically visualizing wait times at exit gates and concessions, charity lotteries, and corporate communications solutions.

Be sure to visit Bannister Lake at the 2020 NAB Show, Booth SL4711.

Bannister Lake Announces Partnership With Multimode Transit and Mobility Data Provider Roadify Transit

Bannister Lake announced today that it has entered into a partnership with Brooklyn-based data aggregator and distributor, Roadify Transit. Roadify specializes in capturing live multimode transit and mobility data from transit authorities, bike share programs, in addition to car and ride share services from around the world. Bannister Lake has developed and implemented a data parser for Roadify data that ingests schedule and real-time transit data directly into its industry-leading Chameleon data aggregation and management solution.

Within Chameleon, users will be able to strategically customize Roadify location-based data with other real-time data feeds, and use BLADE, the product’s RESTful API, to strategically distribute data to specific endpoints for visualization. By targeting and extending transit and mobility data to online, mobile, OTT, and web widgets, Chameleon users will be able to create new data products that reach more viewers and generate new revenue.

The addition of Roadify data will allow Chameleon clients to be able to create location-specific live transit displays ideal for arenas, public events, and corporate campuses. The data can also be used by broadcast users to provide viewers with up-to-the-second mass transit information informing commuters of service alerts and on-time status. The combination of Roadify data and Chameleon software will provide a complete view of multiple area transit and mobility system conditions while supporting sponsorships, advertising, and other supplementary editorial content such as school closings, events calendars, local news, and traffic.

“Reliable, consistent transit information that includes car and bike sharing is critical to commuters,” said Georg Hentsch, president, Bannister Lake. “Managing that data through Chameleon and making it readily available to any screen, anywhere, is an important public service, and we are thrilled to be working with Roadify to fulfill this mandate.”

“As transit and mobility options proliferate, Bannister Lake will make it easy for riders to find out what’s going on around them right now, simply by looking up at a display,” said Scott Kolber, CEO, Roadify. “We’re especially excited that Bannister Lake will be making RoadifyTV, our new integrated data selection and deployment tool, available through Chameleon. RoadifyTV is specifically focused on digital signage services, and Bannister Lake will be among the first wave of our partners to use it.”

Bannister Lake provides both broadcasters and digital signage operators with exciting new opportunities to present data and graphics in innovative ways that leverage automation, data query, and business rules. As a real-time data expert with strong development skills in database, APIs, and applications, Bannister Lake designs, builds, and implements solutions that leverage editorially relevant data sources to engage audiences and attract advertising revenue.

Real-Time Data: Digital Signage’s Secret Weapon

Published in Digital Signage Connection

Digital signage networks are only effective if audiences pay attention to content. That means eye-catching, on-brand design, relevant information and content that gets refreshed regularly. In an ideal world, a team of content creators, marketers and communications professionals will be working around the clock ensuring that the network has the most up-to-date content and that the business and communications objectives of the network are consistently being met. In reality, signage networks depend on sophisticated content management systems that use automation to both update content and set rules and parameters to ensure that content is being programmed consistently.

This is where real-time data feeds play a vital role to ensure audiences are presented with the most important content. Data tickers are a common ingredient in digital signage presentations. News, stock data, sports scores and weather have become an expected and appreciated part of digital signage in many cases. But real-time data can do so much more and transcend virtually every sector of the signage industry. Real-time data from multiple internal and external sources can be used to raise the editorial bar and be put to work to keep audiences engaged and connected.

Real-time data is everywhere; from manufacturing processes to retail analytics to sales statistics. Fast, slow and static data is present across the many sectors where signage is installed. However, much of that data is confined to spreadsheets and proprietary databases and isn’t shared via signage systems. If that data could be ingested, managed, visualized and distributed strategically, communicators would discover an incredibly powerful and automated content type that could have immediate benefits. The fear many communicators have is getting a handle on all that data content and being able to “cherry pick” what is relevant and what is not before distributing it to the proper endpoints. Communicators are also used as tools that visualize data in simple ways; line drawings, basic pie charts and bar graphs not appreciating that there are other ways to display data that take advantage of innovative design and have more engaging outcomes.

On a technical level, signage companies that want to incorporate real-time data sources are required to create a huge library of readers and create custom code to handle integration. This has traditionally been a huge headache. The problem lies with different data feeds having their own unique structure and a general lack of consistency. An alternate approach would be to use readers to ingest real-time data into a centralized database and then apply a standardized set of software tools to manage the data. These tools would be used to moderate, edit, schedule and trigger data according to parameters predetermined by the communications team. The feeds can then be fully customized editorially, reformatted technically and strategically distributed through an API.

In this scenario, dozens of real-time data feeds could be handled simultaneously, and various combinations of the data content would find their way on to select displays that made the most sense from a communications and business perspective. This approach to real-time data is well established in the broadcast industry. Television stations and networks that work with news, elections, sports and financial data select content that they deem important to their audiences, leveraging automation and graphics to keep the information relevant and current. For example, a sports producer who needs to illustrate the top rookies in the MLB with high batting averages will use a data query to “pull out” those statistics from an enormous pool of baseball data. The query can then populate a graphic template that is quickly put to air. The same process can be applied to digital signage, where big data needs to be dissected to reveal a trend or a new business opportunity.

An example from the digital signage industry is the recent U.S. Open Tennis Championship in Flushing Meadows, New York. Multiple video displays of every size and shape throughout the tennis facility were populated with specific data content. The screens were used to keep fans up to date, promote sponsorships and add a heightened level of fan engagement. Producers strategically directed content to specific screens to accomplish specific editorial requirements.

Real-time driven signage at the US Open Tennis Championships

For example, outside the practice courts, producers would display upcoming matches, player biographies, tennis news, schedules and brackets, while the screens located outside the main stadium would display subsets of the live-action data; scoring, serve speeds, number of aces and unforced errors and other game specific data. Producers have come to understand that the signage displays are most engaging and effective when the live data content is relevant and highly targeted. To accomplish this, they employ the same tools that broadcasters use to aggregate, manage, visualize and distribute real-time data.

Across the multiple sectors that digital signage serves, professional communicators and digital signage system providers can leverage the power of real-time data. It is the most effective way to keep screens refreshed, leverage automated processes and keep audiences engaged. Digital signage operators need to get over their fear of big data and seek out solutions that both give them control over data content and foster new business and communications opportunities for their clients and end users.

Bannister Lake Delivers Cross-Platform and Innovative Graphic Solutions for Canadian Federal Election Coverage

Bannister Lake played an essential role providing Canadian broadcast and online audiences with live election results during the Oct. 21 national election. In addition to providing the editorial tools to producers, Bannister Lake enabled decision desks and graphic operators to identify key races, declare winners, and organize graphic playlists. The company also devised and implemented on-set touchscreen mapping widgets and social-media solutions.

This marks the 18th time Corus Entertainment’s Global Television Network has used Bannister Lake solutions to drive election coverage. Elector software was used to aggregate and manage election results and populate graphics that were rendered by four different engines: HTML5, Avid/Orad, Ross XPression, and Vizrt. This provided Global Television with multiple options to visualize election results and present them in exciting new ways. Graphics appeared as full frame, as part of the broadcast’s unique video wall, as regional L-bars, as augmented reality elements, and as online winner cards that were tweeted out.

The broadcast’s touch-enabled HTML5-based widgets proved to be a distinctive storytelling device. The solution allowed hosts to blend real-time data with demographics information on electoral district maps and walk viewers through trends and analysis. Since the solution was built entirely in HTML5, editorial and cosmetic changes could be executed quickly without reliance on other hardware or software systems.

“Having Bannister Lake data available on various endpoints meant we had maximum flexibility to tell the election night story,” said Gerry Belec, director news technology and operations, Global News. “Once again Bannister Lake ensured that both our editorial and production teams had the data and the tools to execute a great election night broadcast.”

At the Cable Public Affairs Channel (CPAC) studios in Ottawa, Bannister Lake integrated election result feeds from the Canadian Press and producers fully utilized Elector to filter and display results. CPAC took full advantage of Elector’s advanced capabilities to filter regions and quickly identify important developments such as incumbents or high-profile candidates losing or being re-elected. In turn, CPAC could quickly create graphic playlists for use on-air.

“Elector race software gave us the ability to parse the incoming results quickly and zero in on important voting trends,” said Steve Rifkin, manager digital content, CPAC. “This allowed us to instantly deliver results to our audience.” 

“Over the years we have developed a deep understanding of election data and know that producers require a straightforward approach to pull insights out of results data,” said Georg Hentsch, president, Bannister Lake. “It is always satisfying to see broadcasters using our tools in innovative ways to reach Canadians on such an important event.”

Bannister Lake’s Elector software is Canada’s trusted election-data solution, providing broadcasters with the widest and most complete variety of tools to analyze, filter, and display election results. For U.S. and other style of elections, the company’s Chameleon product comes equipped with an election module suitable for aggregating and managing results and displaying graphics.

Bannister Lake’s Elector Software to Play Key Role Keeping Canadians Informed for Upcoming Election Day Coverage

Canadians go to the polls on October 21 and once again Bannister Lake is providing two national broadcasters with complete election management solutions. Bannister Lake clients Global Television and CPAC, the Cable Public Affairs Channel, (Canada’s version of C-Span) will be using the company’s Elector software to produce election night coverage. Elector allows producers to instantly see and track real-time results, take advantage of advanced filtering to zero in on specific races, make race calls and quickly and accurately create graphic playlists for broadcast. 

Elector features a multi-user, web-based user interface making the product accessible to production teams anywhere. Producers and analysts can quickly and accurately spot voting trends and translate those trends into powerful graphic presentations. Graphics can then be dragged and dropped and organized into playlists in preparation for broadcast. Elector’s Restful API can be used to strategically distribute real-time data content to online destinations, widgets, mobile devices and augmented reality and virtual reality systems.

“Election night is an important opportunity to not only bring audiences up-to-the second results but to use that data to identify regional, demographic and historic shifts, and present it all with spectacular graphics,” said Georg Hentsch, president, Bannister Lake. “Elector provides production teams with the tools to easily reveal those trends and clearly communicate to viewers how results are unfolding.”

Elector is an election results solution engineered and designed exclusively for Canadian elections; however, Bannister Lake’s popular Chameleon data management product includes an election module that supports U.S. and any other election process. Like Elector, Chameleon election data can feed multiple broadcast graphic engines, online, mobile and other broadcast visualization systems. Bannister Lake is expanding its election offerings with data driven web widgets that allow online users to customize data to specific electoral districts to access local information and analysis.

In addition to Elector, Bannister Lake will provide Global and CPAC with a variety of professional services, including coordination with the Canadian Media Election Consortium to ensure results data is fully optimized for the Elector product.


The Late Show with Stephen Colbert Selects Bannister Lake to Integrate Live Data-Driven Graphics

Bannister Lake, the leading provider of professional broadcast data aggregation and visualization solutions, today announced that the company’s graphic integration services were used to generate key graphics for the special live election night broadcast of The Late Show with Stephen Colbert on Nov. 6. To help audiences visualize the unfolding results of the midterm elections, The Late Show’s production team turned to Bannister Lake to prepare and integrate graphics into the live broadcast that showed the House of Representatives and the Senate populated with the number of elected officials.

The Late Show used Google Sheets to tie data to the graphics and to manually make changes as required. During the election special, Bannister Lake’s role focused on transforming The Late Show’s creative graphic concepts into templates ready for playout. The graphic work was performed by Bannister Lake’s Creative and Technical Director Al Savoie, and data integration was carried out by The Late Show’s production staff.

“Bannister Lake has a long-standing relationship with key members of the graphics team at The Late Show and when we were asked to help out with its election coverage, we immediately said yes,” said Savoie. “We have done countless election broadcasts integrating data and graphics, but we’re especially honored to have been chosen by The Late Show’s team and take part of midterm election history.”

Bannister Lake provides software and services for managing and visualizing data for a broad range of projects including real-time election results, social media, financial information, sports, news, and weather. Bannister Lake’s flagship software solution, Chameleon, is the industry’s most advanced broadcast data engine that allows users to input any kind of data to populate and manage graphic templates. With Chameleon’s Google Sheets Custom Reader, media producers can automatically pull data content from Google Sheets cells and seamlessly populate graphic templates. In addition, producers are able to take full advantage of Google Sheets’ sharing capabilities, granting access and editing rights to multiple users contributing to the content. Data can be organized by topic and displayed using the Google Sheet tab, with Chameleon’s Google Sheets Custom Reader capable of handling multiple sheets and tabs for an efficient and elegant way to display complex broadcast graphics.

Bannister Lake Announces Partnership with Live Data Graphic Design Firm Motion Path

Bannister Lake is pleased to announce that it is partnering with Montreal-based broadcast design firm Motion Path to provide complete data visualization solutions for the broadcast and visual communications industry. Bannister Lake’s powerful data management software, custom development solutions, and implementation expertise combined with Motion Path’s award-winning graphic design capabilities creates exciting new storytelling efficiencies and possibilities for news and sports producers, station groups, event producers and digital signage networks.

Bannister Lake provides broadcasters with the industry’s most powerful automated live data management engine, allowing a wide variety of data formats to be parsed, edited, moderated and strategically distributed. Data appears on-air in the form of tickers, sports bugs, full frame graphics and branding elements. Motion Path has carved a unique niche in the broadcast and digital signage industries by providing graphic design services especially created for live data environments. By combining the two, Bannister Lake driven data will populate Motion Path graphics, delivering a powerful amalgamation of outstanding engineering, innovative production workflows and compelling design.

“Having a strong international design partner like Motion Path helps us add value and efficiency to clients who are seeking a flexible and powerful way to populate graphics with live data from any source,” said Georg Hentsch, president of Bannister Lake. “We had an excellent experience working together recently on the Ontario election with TFO and we look forward to working on many more data-rich projects together.”

“Bannister Lake’s data solutions will give our clients a straightforward way to manage complex data sets that will integrate beautifully into our designs,” said Anton Maximovsky, president of Motion Path. “Very often, data management was something our clients struggled with, needing to custom build a solution or had to compromise their expectations. By linking our graphics to Bannister Lake’s solutions, we have opened up many more creative possibilities for our clients.”

Both Bannister Lake and Motion Path are veteran election specialists and have provided broadcast clients with election race software systems and election graphics packages, respectively. Today’s partnership announcement will strengthen both companies’ election offerings and provide a complete end-to-end solution for election producers. The partnership also helps power Motion Path’s breakthrough work in virtual reality and augmented reality by incorporating Bannister Lake’s data tools to drive on-air presentations. Beyond elections, both companies look forward to providing innovative real-time visualization solutions for sports, financial news, events, eSports and digital signage.