Query about EA’s FIFA eTournament

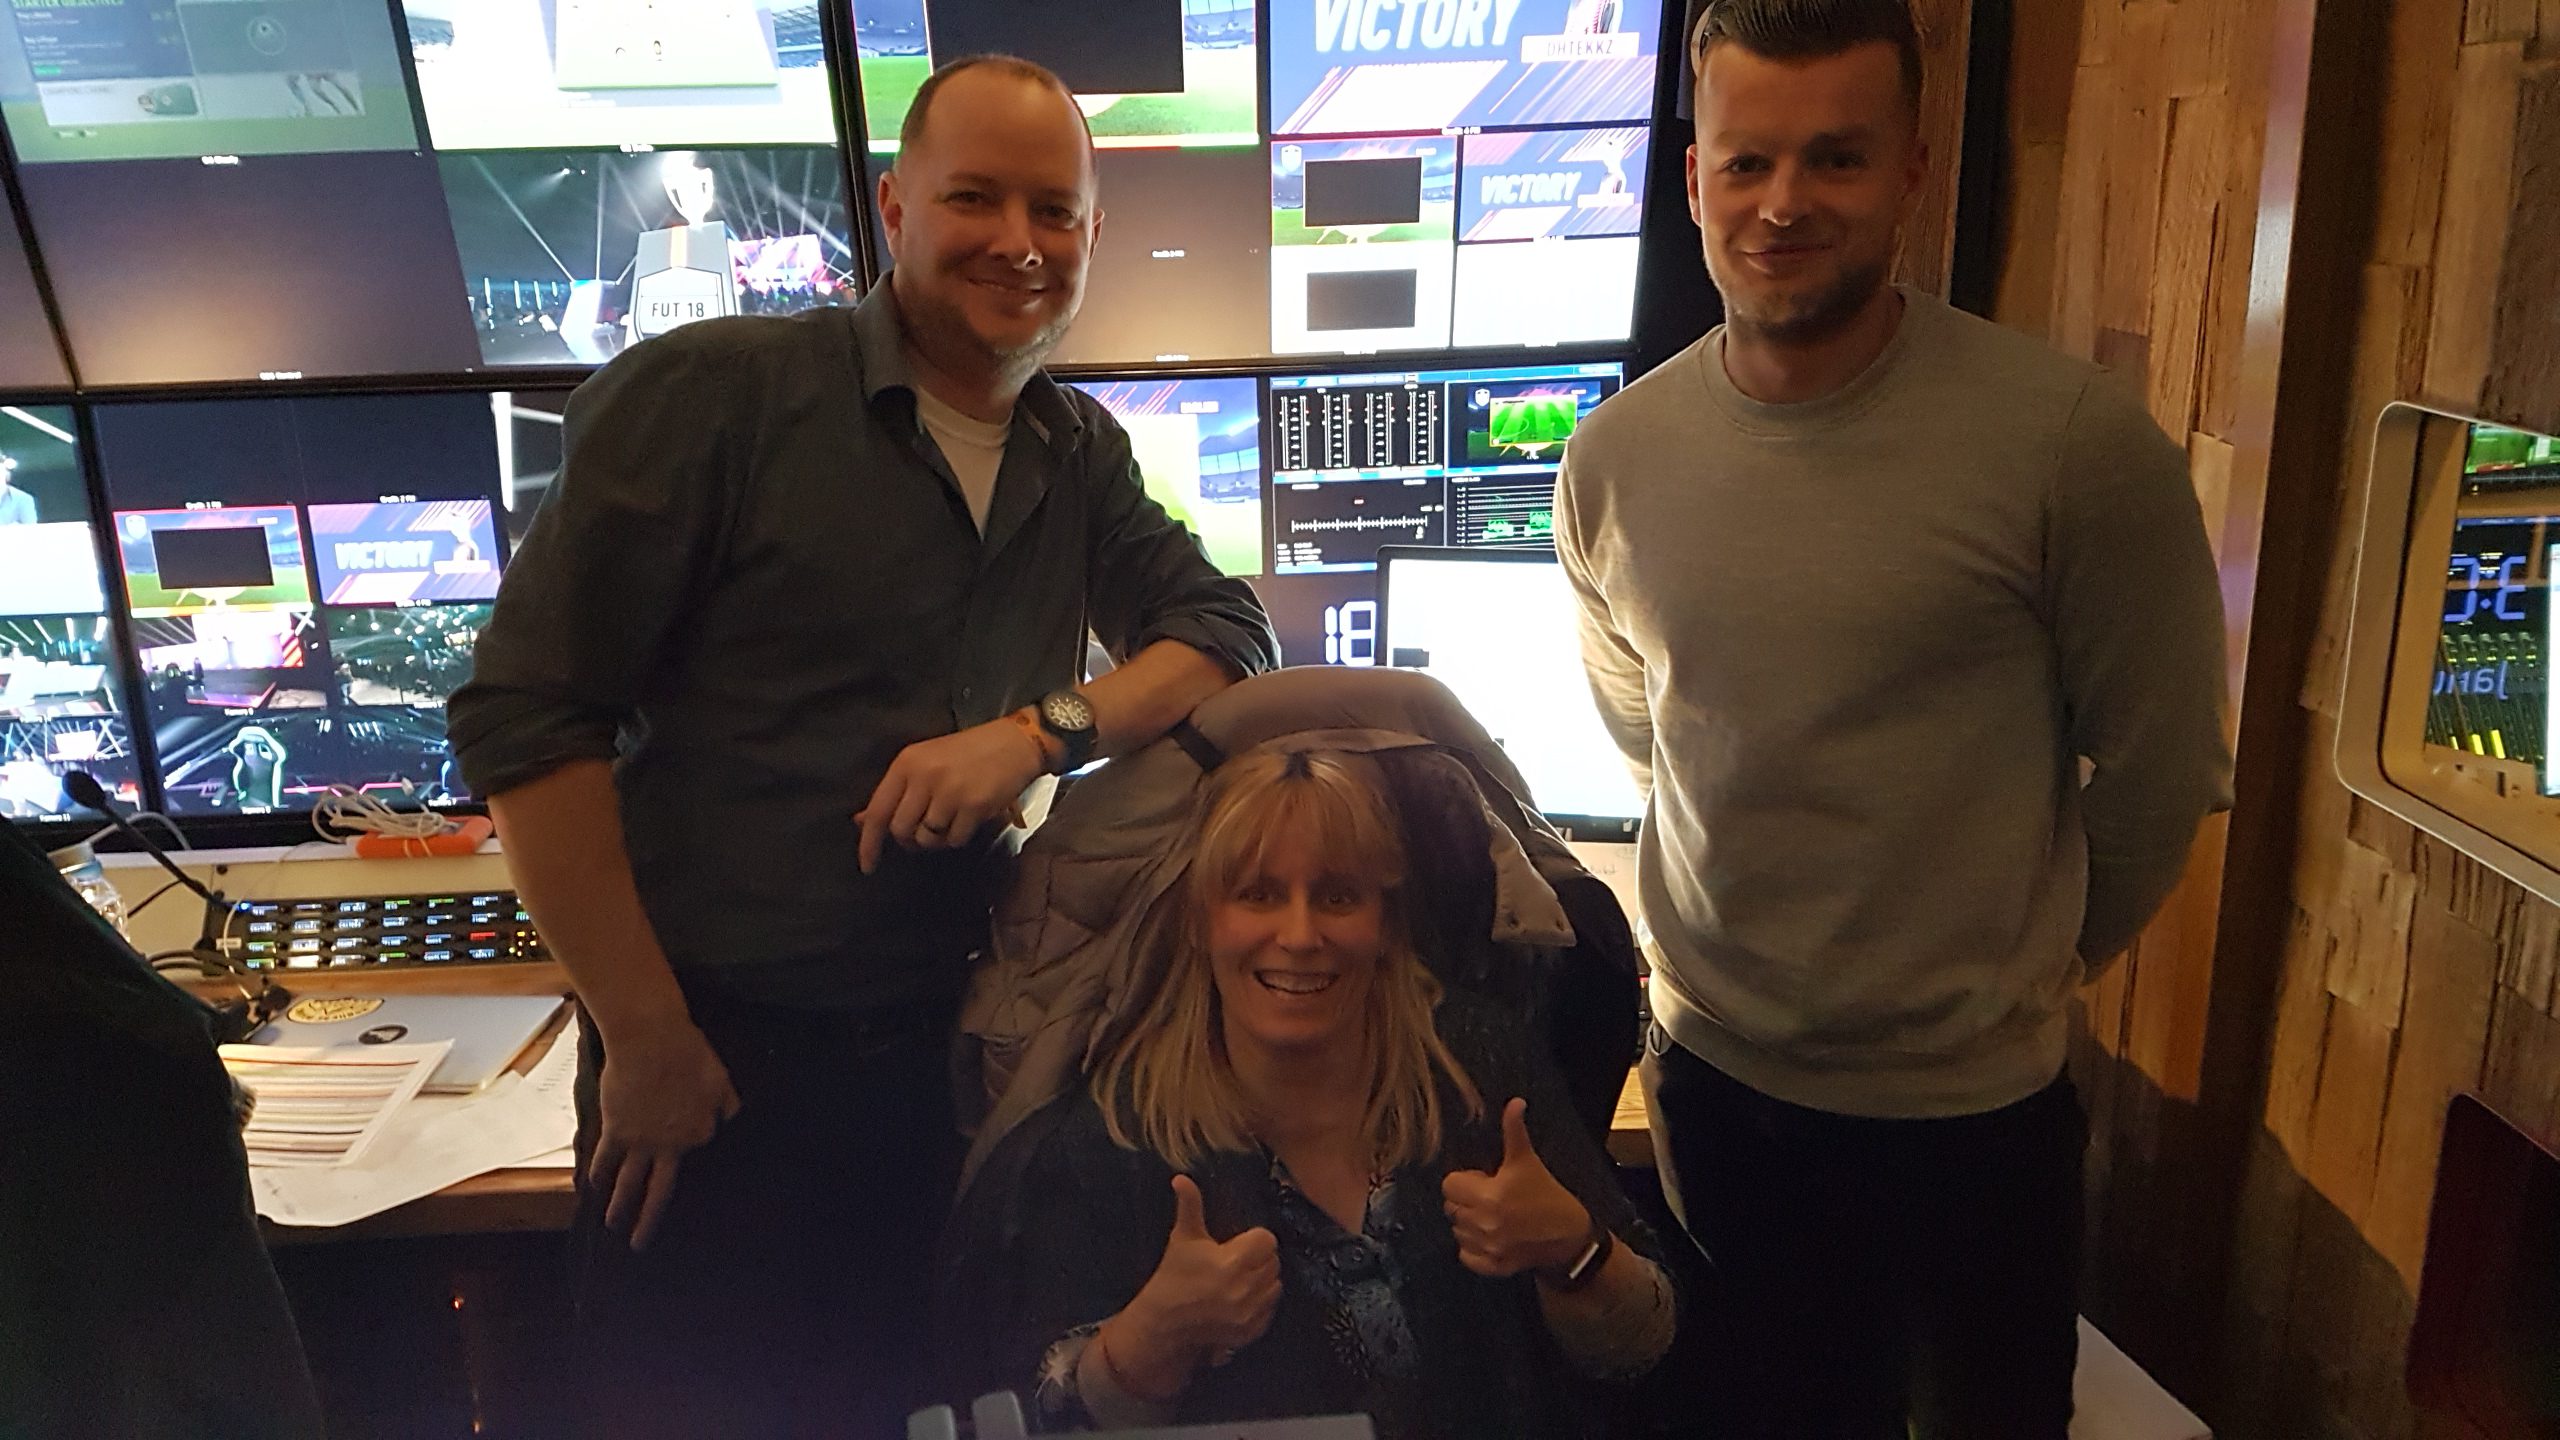
Al Savoie is the Creative and Tech Director at Bannister Lake who recently worked with EA Sports to come up with way for gamer data to play out and hit the masses. The event is a marathon, taking place over 3 days with 128 players, on both Xbox and PS4 consoles.  Friday was a Swiss tournament round, with Saturday and Sunday being the Bracket Elimination Rounds. Here are some industry insights from his week in Barcelona.


Can you describe the client and what they needed to happen for this tournament?

Sure, but let me give you a little background first.

With eSports tournaments becoming more popular as an event, watched by millions around the globe, eSports productions want to try to match conventional broadcast quality programming.

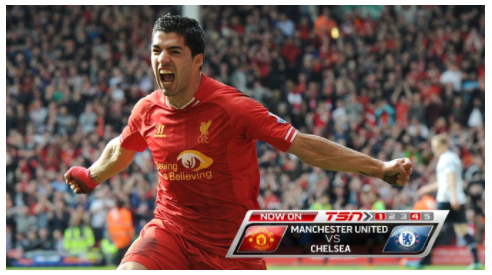
They want to match broadcast production, similar to what you see in NBA or NFL live events. But unlike those conventional offerings that focus on one game, eSports had 511 games over the course of the tournament increasing production demand.  And keep in mind that each game is roughly twenty minutes in length so a lot of turnaround.

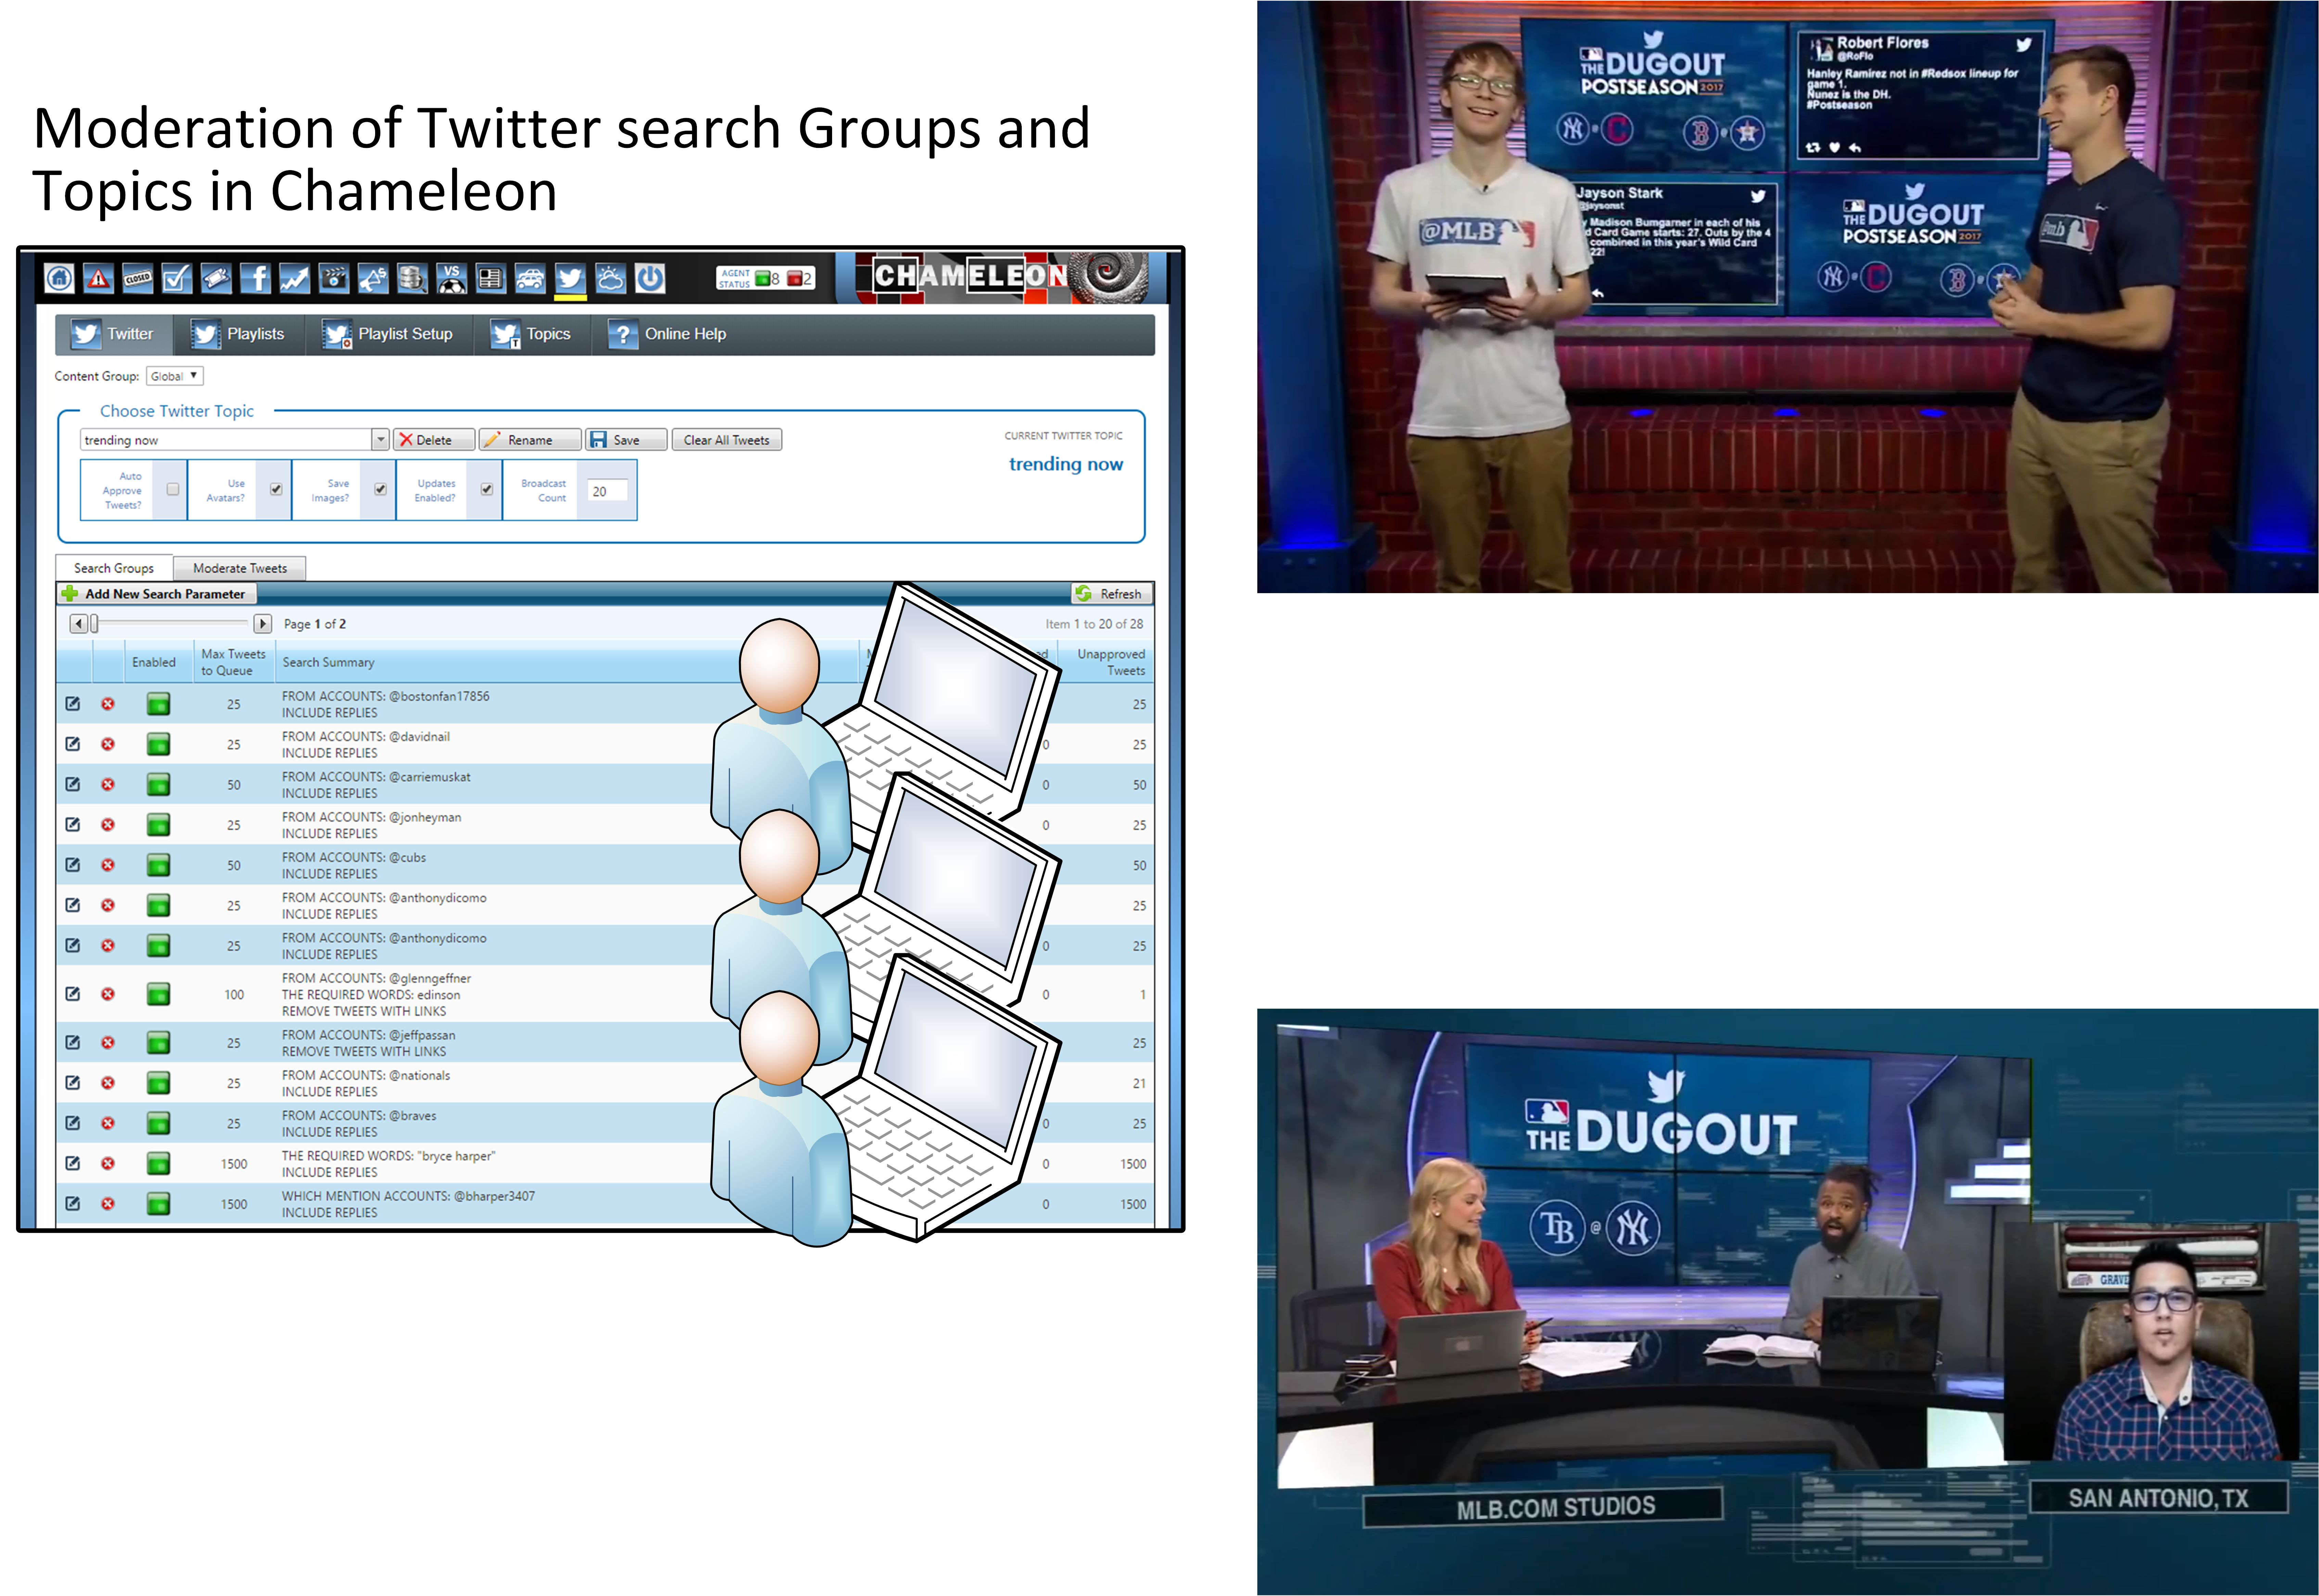
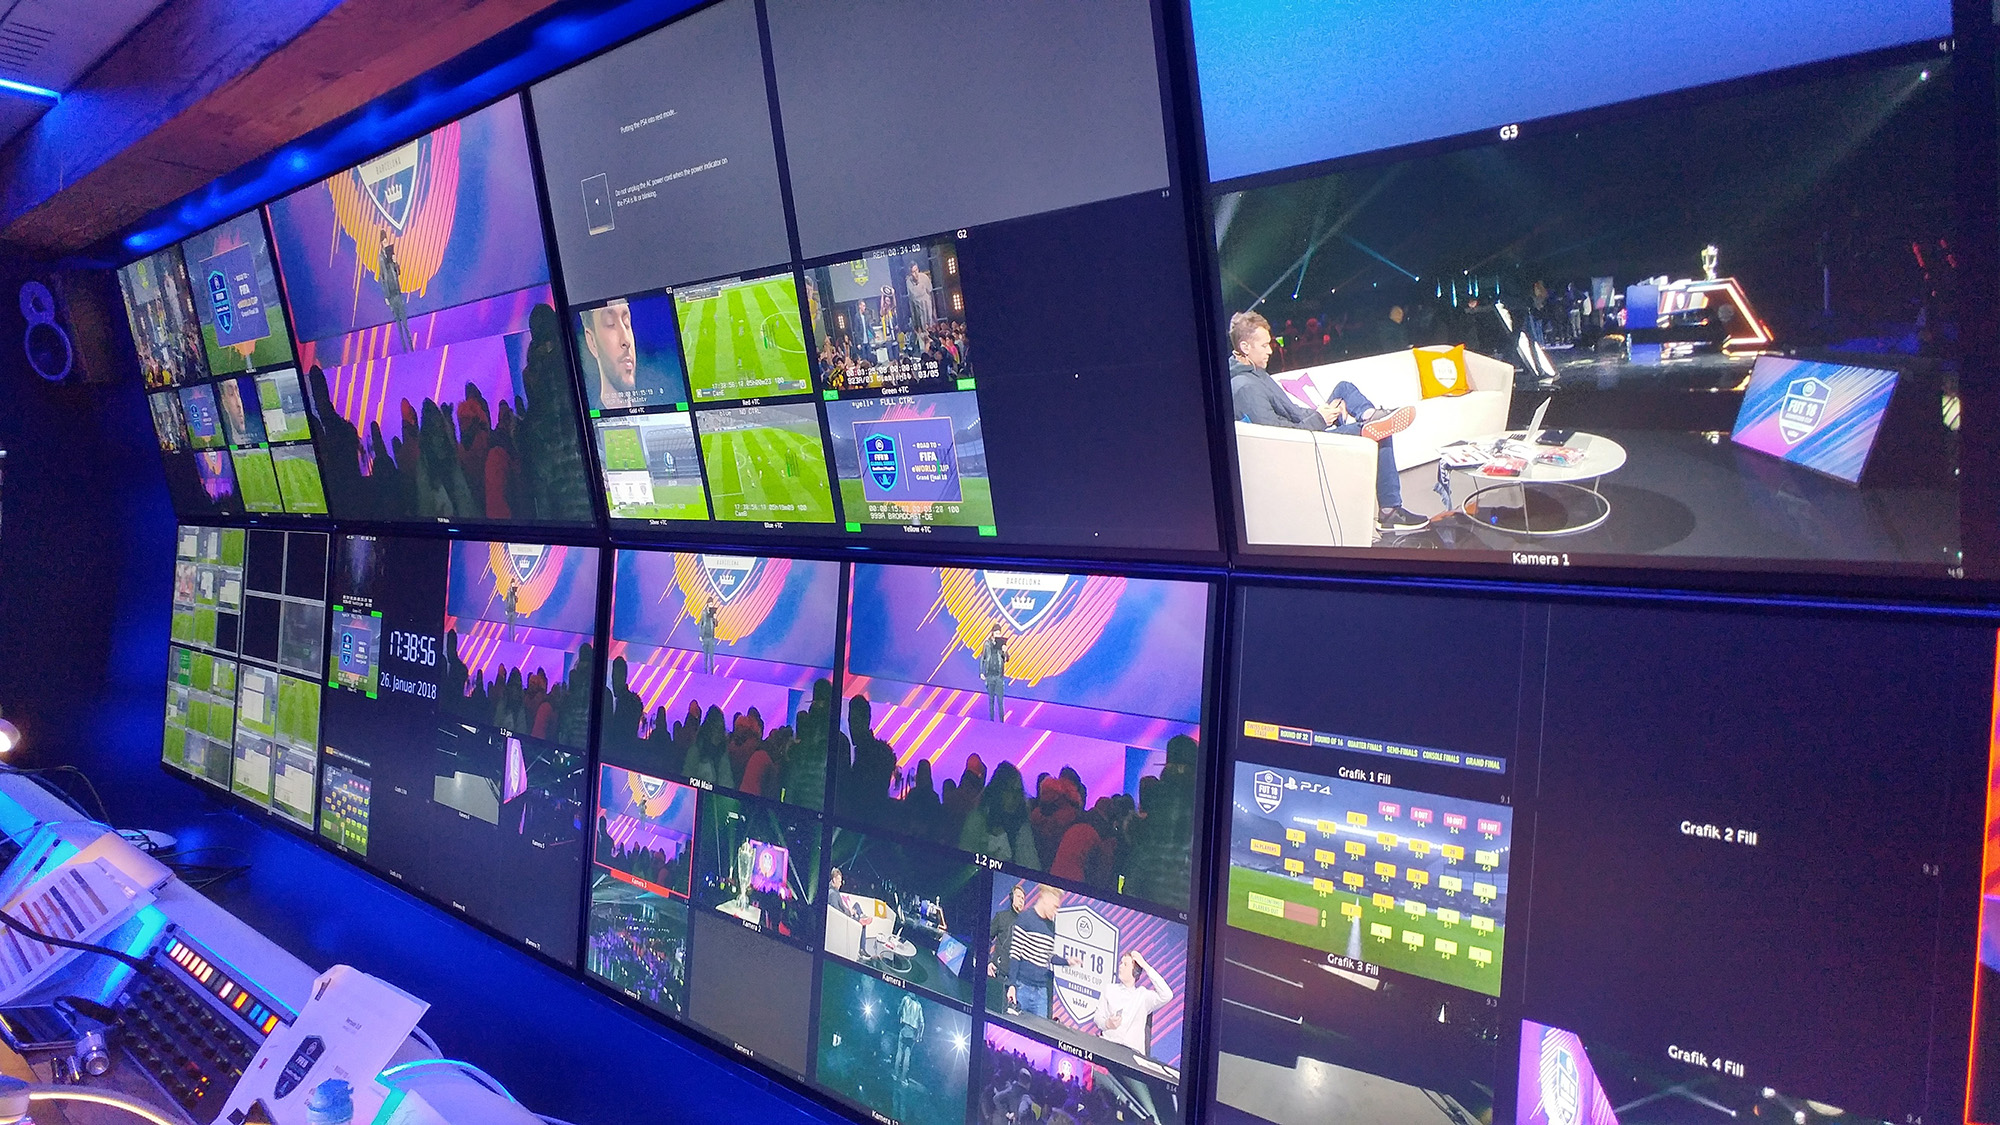
Camera, audio, lighting are pretty standard, but BOOMBOX Group needed a way to filter and moderate all those player stats and then display it in some way graphically.  They needed a tool to allow them to easily do this. In the past they were limited in how to display player stats with such a quick turnaround – it wasn’t easy to moderate.

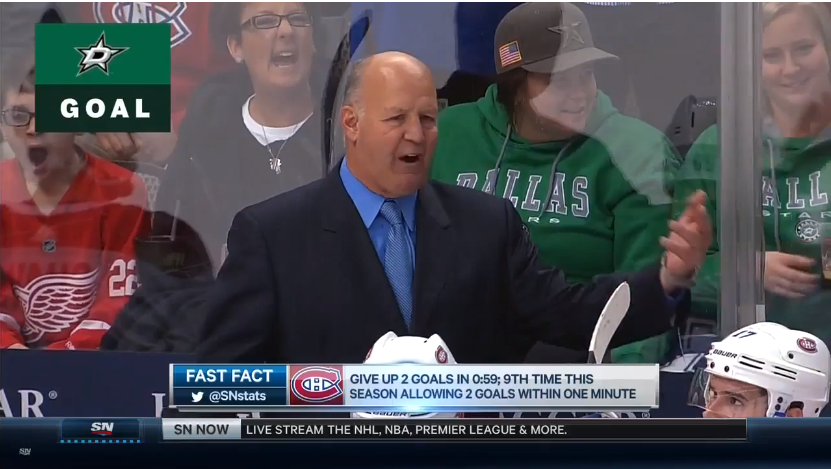
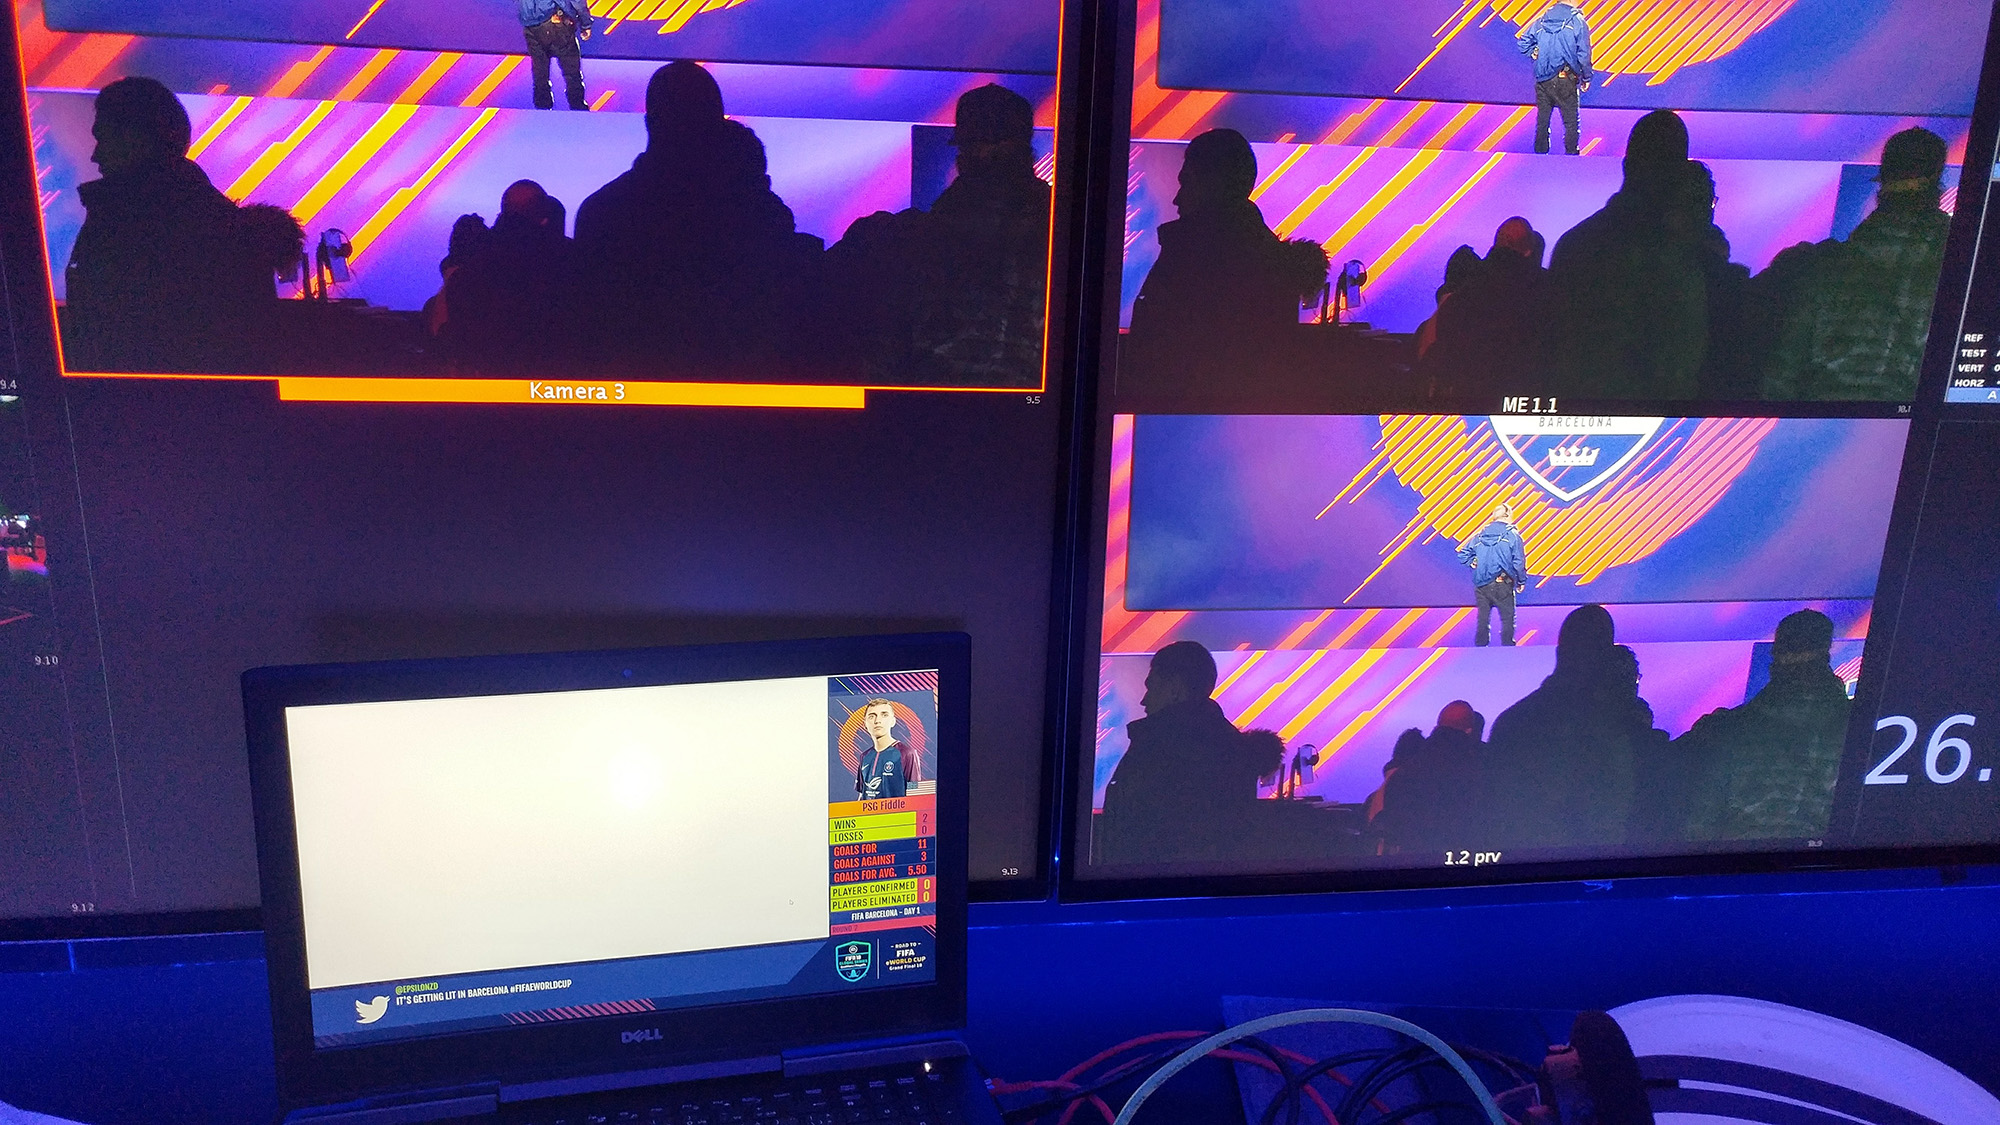
For example on the Friday, the first day Swiss Bracket Round,  there was no way to display  gamer wins or losses, goals for or against for the 128 players over the 7 Rounds.  Since broadcast couldn’t focus on all the games at the same time, they needed a way to display that information for the viewers.  The Chameleon provided a solution to automatically populate player stats without a need for inputting manually.


The key idea behind BOOMBOX using Chameleon in this production was to assist in filtering and moderating data, to be used primarily in XPression on the Saturday and Sunday broadcasts, but also as a ticker using Chameleon’s own rendering engine.

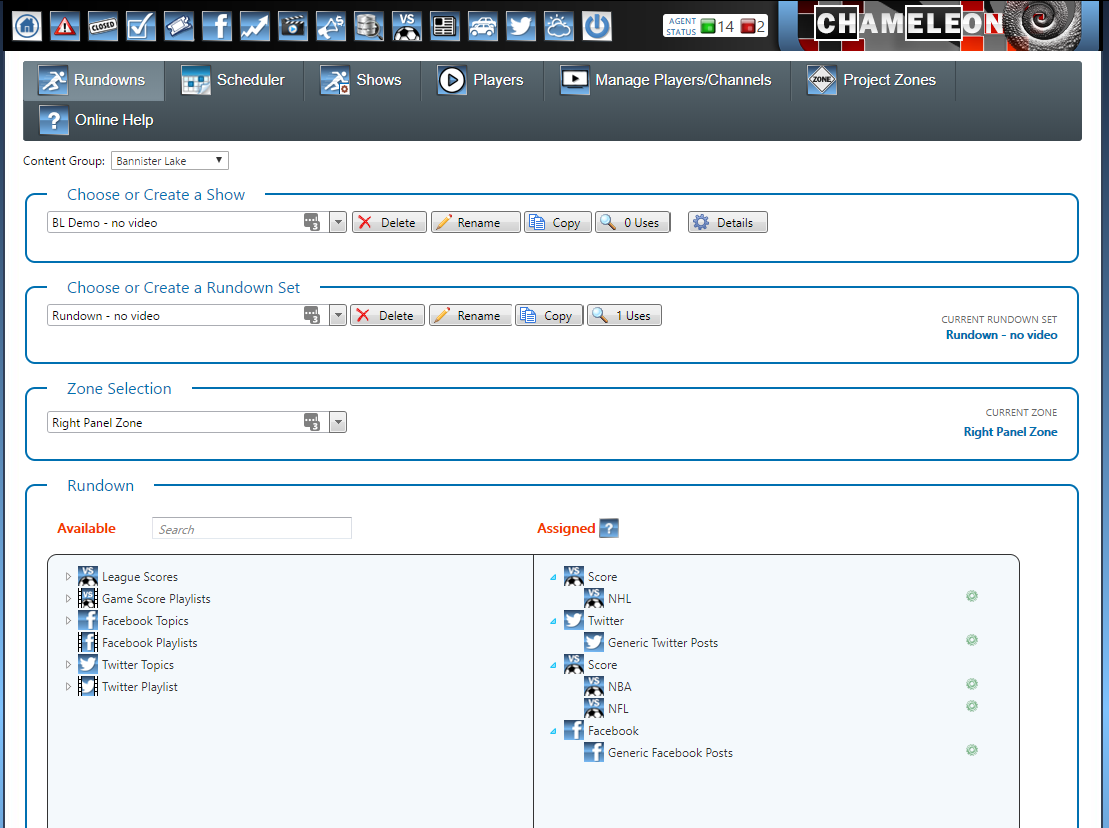
Chameleon’s Query module was required here.  We needed to create APIs for XPression to easily search players based on a round and who they were playing against.  Data was to be entered manually on location by the tournament ops crew, and sent over to the Chameleon database using a custom reader written by Georg at BL.  Once in Chameleon,  we wrote our own queries to filter what we needed for XPression.

With XPression settled, they also wanted to add another layer, in the form of the Chameleon web player, as the primary graphics system on the Friday during the very complicated Swiss format elimination round.


How many staff were involved? How does it compare to other large scale live events that Bannister has been involved in?

Well, typically Bannister Lake participates in elections in terms of live events. Our solutions are usually for tickers and branding that exist on a network, 24-7.

What makes this interesting is that an election is very similar to a lot of eSport events, in this case the candidates are the gamers, all competing and vying for a spot in the finals. It requires up to the minute stats/results. Usually elections require a lot of manpower but Chameleon doesn’t. It was a two-man job from the outset for us. Our software is designed to be very efficient; not a lot of staff required.

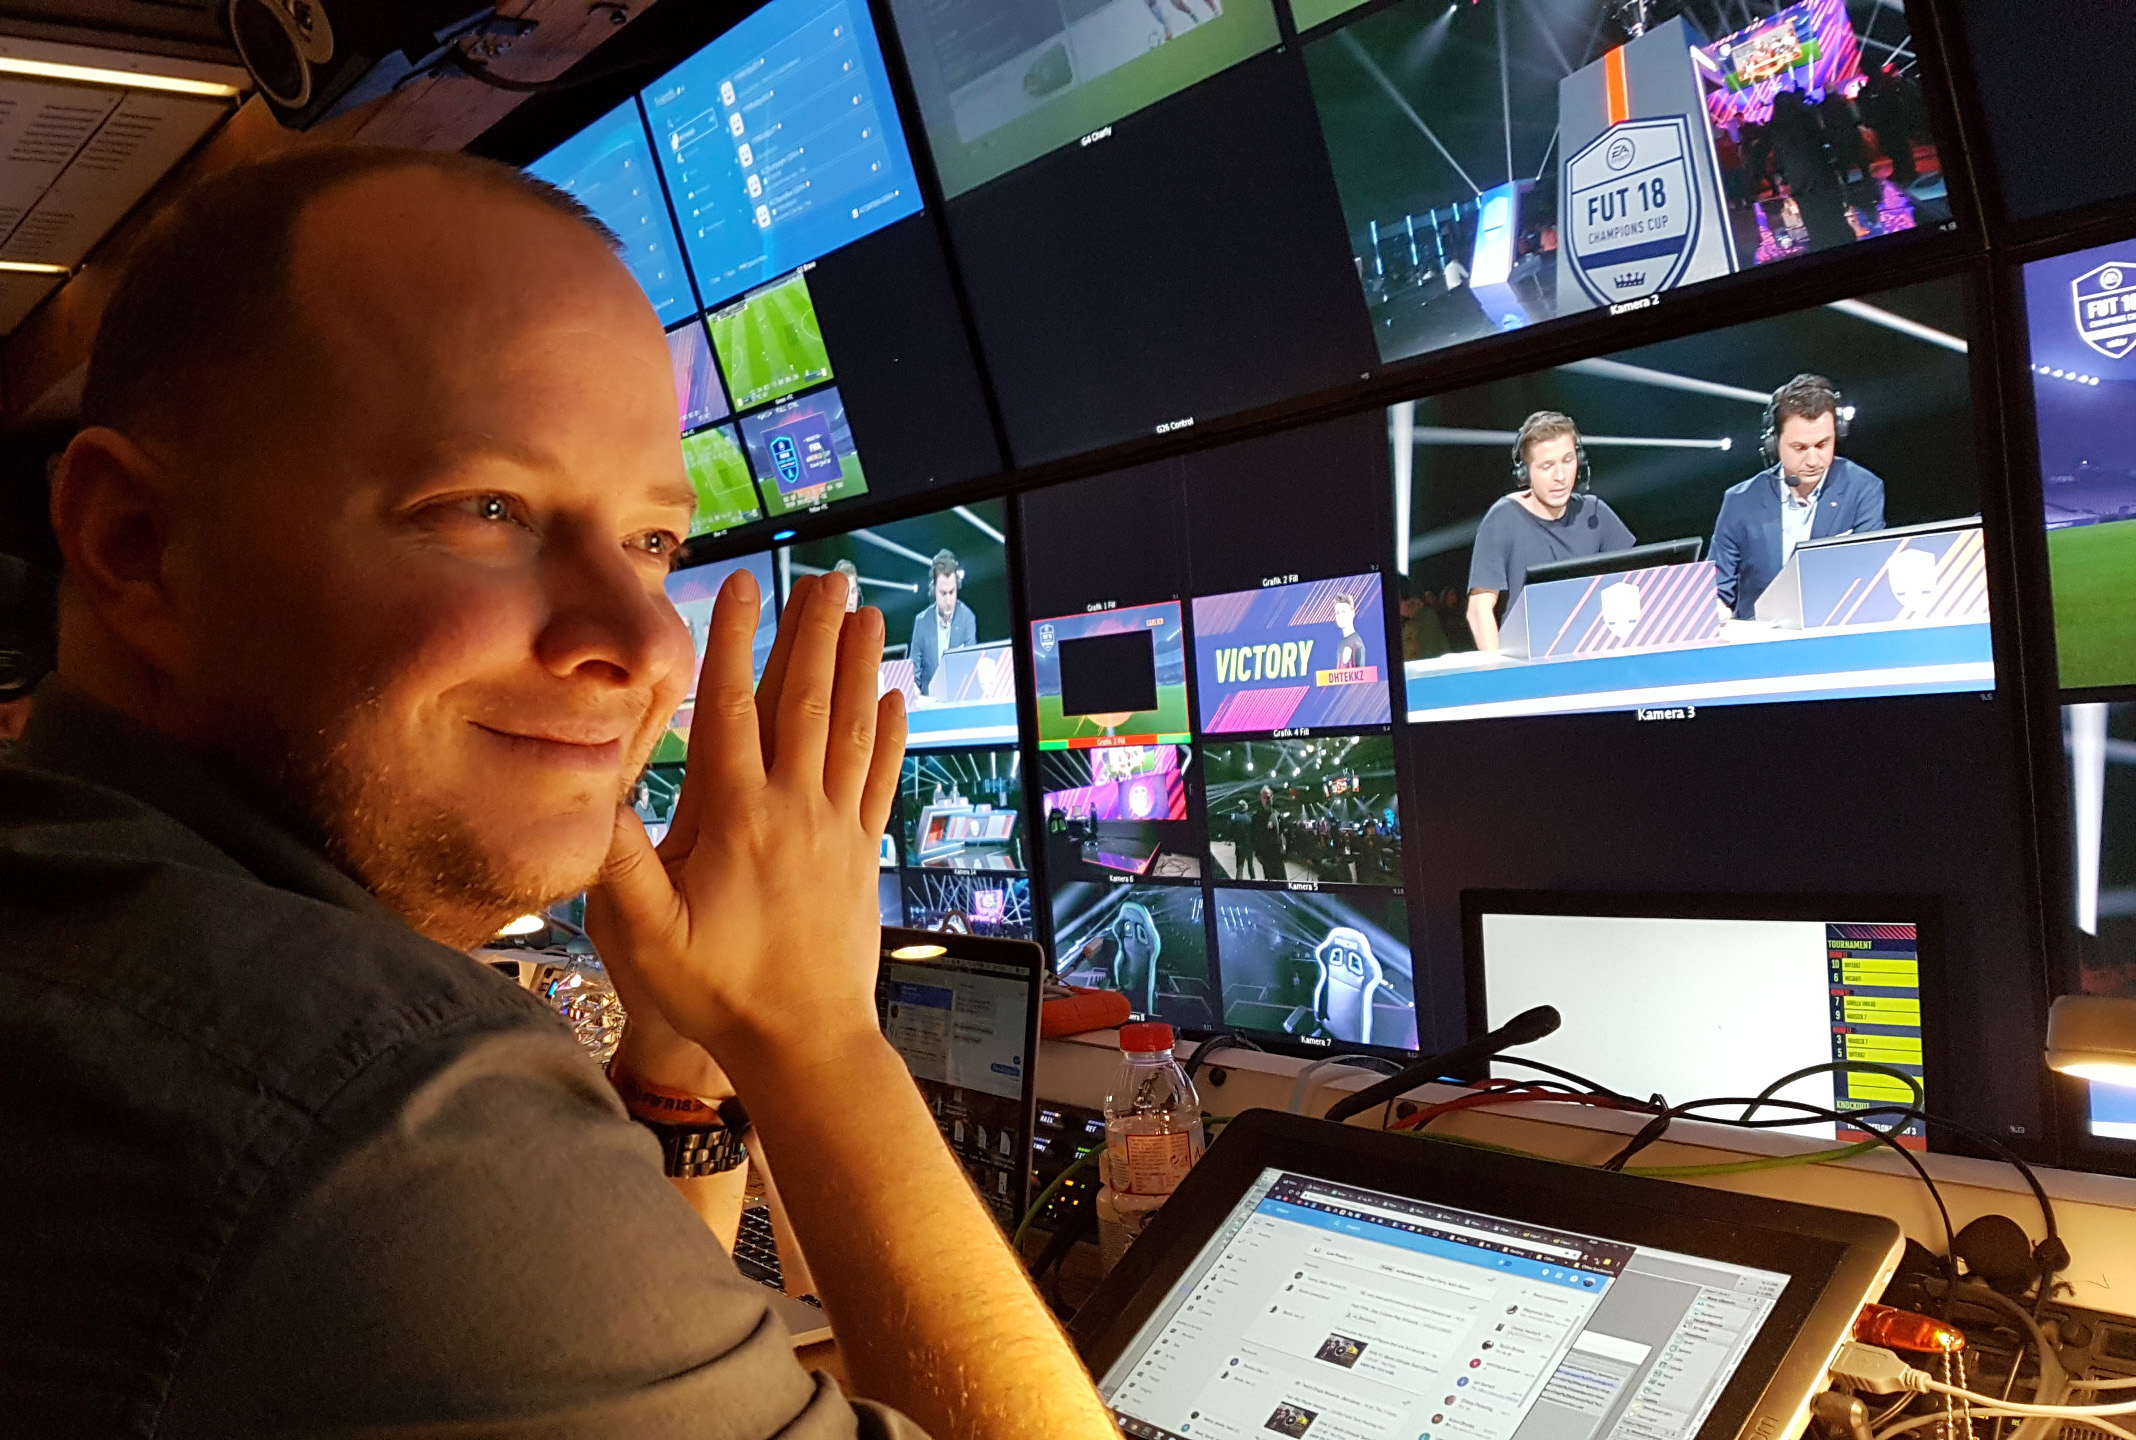
As for production staff, it took the same amount of people to produce NHL game, for example. For broadcast professionals, they may feel like this type of production feels cheaper only because the play out is non traditional (Youtube/Twitch),  but one could argue that the amount of money is equal, if not more, than a produced NHL game. Most staff were working 12 for 14 hour days and there is a ton of work and back end effort being put into these games! On the day, using Chameleon, there were 6 production and social media staffers populating content. For a Canadian election, like the Canadian Global Television broadcast, it’s usually about twelve production staffers who will use the product.


So there were a lot of firsts for this EA eWorld Championship?

Yes. First time our Chameleon renderer was used in a live event.  For the event, it was the first time being able to aggregate such a vast amount of data. That data was used on our web output that circulated player stats throughout the tournament. They used tickers in the past but nothing like this. In fact, hosts were entering info themselves!  That’s the Millennial generation; instead of using Twitter, the talent used our system and created a sort of exclusive news aura, or a community, around the event.


What were some of the key benefits you told BOOMBOX about using Chameleon web as part of the production?

First, Chameleon UI being a browser based platform, made it easy for anyone to jump on and input/moderate data.  Second, our Chameleon renderer outputted data where they keyed the live video overlay on top.  Rather than spend thousands on a broadcast CG system, instead, they used a Chrome browser and a laptop.

Chameleon was a huge hit. The L-Bar Chameleon web ran throughout the whole weekend, displaying news, tweets, player cards and scores. Their social media team literally had a 15 minute tutorial on how to use Twitter in Chameleon, and they got it. The hosts were responsible for entering news using their iPads on the floor, with a moderation level by the EA executives.   They too only had a 15 min tutorial but got it quickly.  
EA,  Boombox and NCompass were extremely pleased with what we offered. It really helped elevate their production to another level.  One in which they now can’t go down from.   
 

What were some of the challenges trying to manage such a large team roster? There were a total of 128 players, correct? That’s almost as large as a world championship sporting event.

Well, it is a world sport championship event. Sure it’s still one venue with everyone in that one venue but we are still talking about over 500 individual games being played. On the Chameleon end we had to make sure the leagues were separated between XBox and PS4 consoles. After that we needed to log all 128 players with their qualifying stats and upcoming tournament stats. Since we aren’t using player names, we were using “gamer tags” who love to change their tags, often up to the night before…that’s about 25% that needed to match these new names with their qualifying stats and headshots.


What’s the future of data in eSport events?

We have two tournaments coming up and we want to continue to improve Chameleon and improve what we can offer our clients,  viewers and the gamers.  

Al Savoie is a graphics systems whiz who can answer and further questions

Email him at asavoie@bannisterlake.com


FIFA Championship Cup

CAMBRIDGE, ON 01-22-17

Today Bannister Lake announced Chameleon’s powerful graphics and data package will help publish tournament stats during the upcoming EA sports FIFA World Cup Championship.

The tournament, taking place in Barcelona, will showcase some of the worlds best EA FIFA players.  Gamers from around the world have been playing hard in order to qualify for the 128 player roster on Xbox and PS4 consoles.

Chameleon HTML 5 web player will have results during the pre-bracket tournament on Friday Jan 26th.  On Jan 27th and 28th, from the final 16 games to the championship match, Chameleon will collect and moderate game data, including scores, shots, goals for/against that will populate Ross’ Xpression graphics system.  

“Smart, good looking interface,” says Creative and Technical Director, Alain Savoie, “ with a solid data display for real- time wins, losses and player stats during the matches.  The Chameleon Web player is a great tool to show ticker data information of the matches and players, without an operator.  Meanwhile, we can focus on the linear broadcast and XPression, using Chameleon’s RESTful API to populate in-game data.”  

The FIFA World Cup 2018 Championship will be streamed live, all over the world, the weekend of Jan 26th.

About Bannister Lake

Bannister Lake is committed to helping great media companies tell better stories. A software company dedicated to making your media life easier, by bridging your data with high quality graphics.  bannisterlake.com


Yahoo Finance

Customer: Yahoo Finance

Application: Yahoo Finance Application

Printable Version

Yahoo Finance approached Bannister Lake to produce a dedicated financial application to drive all graphic content for their online Financial Channel.

  • Finance Client application authenticates and connects to Yahoo Financial data feed.
  • Client UI provides stock ticker preview and modules to create Bugs, Stock Charts, Name Keys and Lower Thirds.
  • Quick filters to setup stock chart comparisons, desktop preview of charts then quick add to playlist.
  • Drop Down range menu to select time including, Intraday padded, Intraday, 2 day padded, 5 day, 1 month, 3 month, 6 month, Year to Date padded, 1 > 5 year and user defined (Custom) ranges.
  • Client app connects securely to Finance Server app in production to generate graphic output for presentation.


MLB Network, The Dugout

Customer: MLB Network, The Dugout

Application: Chameleon Cloud for Social Media

Printable Version

MLB Network Advanced Media in New York needed a multi-user solution to moderate social media for The Dugout, MLB’s weekly 3-hour program live streaming exclusively on Twitter every Wednesday during the regular season.

  • An instance of Chameleon Cloud was setup for multiple users at MLB.
  • Search topics and groups were defined for ‘Trending Now’ and Twitter accounts for MLB Teams and Players.
  • Users moderated and approved Twitter content into approved Twitter playlists for talent during the show.
  • CG graphic operator with XPression and XPression Datalinq accessed moderated Twitter playlists using Chameleon BLADE (Bannister Lake Active Data Exchange) for presentation of Social Media on set and the streaming broadcast to Twitter.
MLB Advanced Media – The Dugout


Global News BC1

Customer: Global News

Application: Chameleon (Super Ticker Legacy)

Platform: RossVideo XPression

Printable Version

Following in the footsteps of the giant in Canadian info channels, CP24, Global wanted to create a province-wide channel that served the same purpose; an all-in-one place to get your local, national and world news. With a design more in tune to a website than a standard ticker, Global’s goal was to create the modern info channel, BC1.

Super Ticker (the precursor to the ticker function in Chameleon) had all the pieces to deliver on this promise. With data that spanned:

  1. Ski reports
  2. Weather
  3. Scores
  4. Finance quotes
  5. News
  6. Events
  7. Social media
  8. Traffic
  9. Closings

Support for unlimited zones of information and a channel schedule that allowed zones and rundowns to change based on time of day made it all possible. Super Ticker’s web interface Flow gave an interface for all users in the chain simultaneously. And with parsers bringing in data from a wide variety of sources, much of the work was automated.


Rogers Sportsnet

Customer: Rogers Sportsnet

Application: Chameleon (Super Ticker Legacy)

Platform: RossVideo XPression

Printable Version

Rogers Sportsnet has been fighting it out with Bell’s TSN for top prize in the Canadian sports broadcasting landscape. After purchasing the broadcast side of The Score, they wanted to combine The Score’s legendary ticker with the less ambitious tickers Bannister Lake had created for Sportsnet for many years. With 7 channels and their unique ticker requirements, Sportsnet was looking at a single solution to drive them all in an efficient manner while not increasing the operator head count.

The 4 regional channels, Sportsnet East, Ontario, West and Pacific continue to provide a ticker with a regional flavor focusing on information for the region while showing all the national information. These tickers are displayed in a compact fashion to allow the video to dominate.

The newly imagined Sportsnet 360, taking its lead from The Score, became a channel which showed its ticker all the time including commercials and live events. This ticker had more information including betting odds on games and displayed its information in a taller format. This is the channel where hardcore sports fans tune into

Sportsnet One is the national channel while Sportsnet World focuses on world sports like cricket, soccer and rugby.

Super Ticker (now morphed into Chameleon with the inclusion of branding from Brando) became the ideal system to drive these diverse tickers. With a small team of operators organizing the rundowns for these channels, Sportsnet was able to deal with the hectic pace of sports data. While a great deal of the work is automated, Super Ticker’s web interface Flow became the platform for creating the added news that goes into the world of sports and the games and events that drive it.

Super Ticker’s content management was key to success; one database and a multi-user web interface. Super Ticker allows organizing data in a way where the channels can pick and choose their rundowns to include national and regional data.

Bell Media TSN

Customer: Bell Media TSN

Application: Chameleon (Brando Legacy)

Platform: RossVideo XPression

Printable Version

TSN is the leader in sports broadcasting in Canada. On their expansion from one channel to 5, they needed a branding solution to promote the programming of their new 5 channel universe. For example, during a big event like Wimbledon, they might be showing 5 different matches spread among TSN1-5. These promotions included next boards, snipes and navigational tickers.

An added wrinkle is that the branding was mostly during live events. This required a manual triggering method allowing a TD to insert snipes whenever they could fit.

Promotion of big events were also inserted throughout the day with a clear representation of what channels the event will be playing on. In all cases, the promos focused on all 5 channels and included 100s of logos for all the teams and leagues that TSN covered.

Although these requirements didn’t fit a typical branding requirement, Brando came through off-the-shelf.

Brando was the branding ancestor of our merged branding/ticker/content management product Chameleon. We kept everything which made Brando great while modernizing it for today’s broadcasting, streaming and digital signage markets.


WDAY

Customer: WDAY, Fargo North Dakota

Application: Chameleon & Community  (under Ross Tick-It)

Platform: RossVideo XPression Studio and BlueBox

Printable Version

Bannister Lake provided an automated broadcast ticker solution for WDAY to support regional school closures.

  • North Dakota regional schools provide school closure information and status through their Community Content Editor Account.
  • Community Closing data is automatically pushed to WDAY’s instance of Chameleon and presented on air
  • Ticker information automatically is displayed on-air without intervention from Master Control.


TVA – TVA Nouvelles TVA Sports

Customer: Quebecor TVA Sports/Nouvelles

Application: Chameleon (Ross Tick-It)

Platform: RossVideo XPression Studio

Printable Version

Bannister Lake delivered a fully automated redundant broadcast ticker solution for TVA Nouvelles 2 channels and TVA Sports 1/2

  • 4 channels of Chameleon on 4 Xpression BlueBoxes (+1 Backup), pulling data from a central Chameleon server.
  • Chameleon Server is configured as a primary and backup for fail over. (redundancy)
  • Weather feed data driven by WSI
  • Lottery results from Loto Quebec
  • Live sports data is provided by Stats
  • Backup player is a hot spare for any of the 4 on air channels.


News 12 – Traffic and Weather

Customer: News 12 Traffic and Weather (New York)

Application: Chameleon (under Ross Tick-It)

Platform: RossVideo XPression Studio

Printable Version

Bannister Lake delivered an automated broadcast ticker solution for News 12 to display weather and traffic for the 5 regional stations.

  • 5 channels of Chameleon running on 5 Xpression BlueBoxes, pulling data from a central Chameleon server.
  • Weather is a combination of WSI data feed and manual input from their Meteorologist.
  • Data from National Weather Alerts is filtered and prioritized to show only weather data for the regions with a severity of 2 or higher with specific weather conditions.
  • Inrix GeoID app is programmed to read traffic information from coordinate specific regions.
  • Blade is used to populate News12’s website feeds with the same data used on air.